METHOD
204B--VOLATILE ORGANIC COMPOUNDS EMISSIONS IN CAPTURED STREAM
4.2 Captured Emissions
Volumetric Flow Rate.
5.1 Calibration and
Other Gases.
5.1.3 FIA Linearity
Calibration Gases.
6.1 Instrument Quality
Control Parameters
6.2.1 Analysis Audit
Procedure.
6.2.2 Audit Samples and
Audit Sample Availability.
7. CALIBRATION AND
STANDARDIZATION
7.1 FIA Calibration and
Linearity Check.
8.1. Determination of
Volumetric Flow Rate of Captured Emissions
8.2 Determination of
VOC Content of Captured Emissions
9. DATA ANALYSIS AND
CALCULATIONS
1. SCOPE AND APPLICATION
1.1 Applicability.
This procedure
is applicable for determining the volatile organic compounds (VOC) content of
captured gas streams. It is intended to be used in the development of a gas/gas
protocol for determining VOC capture efficiency (CE) for surface coating and
printing operations. The procedure may not be acceptable in certain
site-specific situations [e.g., when: (1) direct-fired heaters or other
circumstances affect the quantity of VOC at the control device inlet; and (2)
particulate organic aerosols are formed in the process and are present in the
captured emissions].
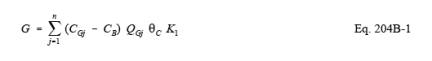
1.2 Principle.
The amount of
VOC captured (G) is calculated as the sum of the products of the VOC content (CGj), the flow rate (QGj), and the sample time (• C) from each captured emissions point.
1.3 Sampling Requirements.
A CE test shall
consist of at least three sampling runs. Each run shall cover at least one
complete production cycle, but shall be at least 3 hours long. The sampling
time for each run need not exceed 8 hours, even if the production cycle has not
been completed. Alternative sampling times may be used with the approval of the
Administrator.
2. SUMMARY OF METHOD
A gas sample is
extracted from the source though a heated sample line and, if necessary, a
glass fiber filter to a flame ionization analyzer (FIA).
3. SAFETY
Because this
procedure is often applied in highly explosive areas, caution and care should
be exercised in choosing, installing, and using the appropriate equipment.
4. EQUIPMENT AND SUPPLIES
Mention of trade
names or company products does not constitute endorsement. All gas
concentrations (percent, ppm) are by volume, unless otherwise noted.
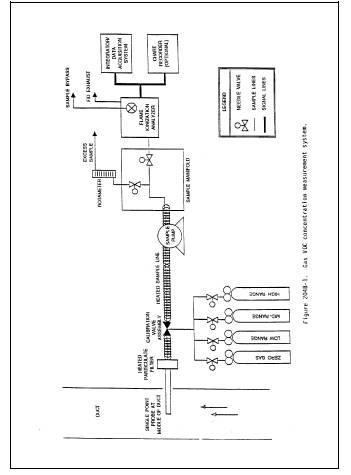
4.1 Gas VOC Concentration.
A schematic of
the measurement system is shown in
Figure 204B-1. The main components are as follows:
4.1.1 Sample
Probe. Stainless steel or
equivalent. The probe shall be heated to prevent VOC condensation.
4.1.2
Calibration Valve Assembly. Three-way
valve assembly at the outlet of the sample probe to direct the zero and
calibration gases to the analyzer. Other methods, such as quick-connect lines,
to route calibration gases to the outlet of the sample probe are acceptable.
4.1.3 Sample
Line. Stainless steel or
Teflon tubing to transport the sample gas to the analyzer. The sample line must
be heated to prevent condensation.
4.1.4 Sample
Pump. A leak-free pump, to
pull the sample gas through the system at a flow rate sufficient to minimize
the response time of the measurement system. The components of the pump that
contact the gas stream shall be constructed of stainless steel or Teflon. The
sample pump must be heated to prevent condensation.
4.1.5 Sample
Flow Rate Control. A
sample flow rate control valve and rotameter, or equivalent, to maintain a
constant sampling rate within 10 percent. The flow rate control valve and
rotameter must be heated to prevent condensation. A control valve may also be
located on the sample pump bypass loop to assist in controlling the sample
pressure and flow rate.
4.1.6 Organic
Concentration Analyzer. An
FIA with a span value of 1.5 times the expected concentration as propane;
however, other span values may be used if it can be demonstrated to the
Administrator's satisfaction that they would provide equally accurate
measurements. The system shall be capable of meeting or exceeding the following
specifications:
4.1.6.1 Zero
Drift. Less than ±3.0
percent of the span value.
4.1.6.2
Calibration Drift. Less
than ±3.0 percent of the span value.
4.1.6.3
Calibration Error. Less
than ±5.0 percent of the calibration gas value.
4.1.6.4
Response Time. Less than
30 seconds.
4.1.7
Integrator/Data Acquisition System. An
analog or digital device, or computerized data acquisition system used to
integrate the FIA response or compute the average response and record measurement
data. The minimum data sampling frequency for computing average or integrated
values is one measurement value every 5 seconds. The device shall be capable of
recording average values at least once per minute.
4.2 Captured Emissions Volumetric Flow Rate.
4.2.1 Method
2 or 2A Apparatus. For
determining volumetric flow rate.
4.2.2 Method
3 Apparatus and Reagents. For
determining molecular weight of the gas stream. An estimate of the molecular
weight of the gas stream may be used if approved by the Administrator.
4.2.3 Method
4 Apparatus and Reagents. For
determining moisture content, if necessary.
5. REAGENTS AND STANDARDS
5.1 Calibration and Other Gases.
Gases used for
calibration, fuel, and combustion air (if required) are contained in compressed
gas cylinders. All calibration gases shall be traceable to National Institute
of Standards and Technology standards and shall be certified by the
manufacturer to
5.1.1 Fuel.
The FIA
manufacturer's recommended fuel should be used. A 40 percent H2/60 percent He or 40 percent H2/60 percent N2 gas
mixture is recommended to avoid an oxygen synergism effect that reportedly
occurs when oxygen concentration varies significantly from a mean value. Other
mixtures may be used provided the tester can demonstrate to the Administrator
that there is no oxygen synergism effect
5.1.2 Carrier Gas.
High purity air
with less than 1 ppm of organic material (as propane or carbon equivalent) or
less than 0.1 percent of the span value, whichever is greater.
5.1.3 FIA Linearity Calibration Gases.
Low-, mid-, and
high-range gas mixture standards with nominal propane concentrations of 20-30,
45-55, and 70-80 percent of the span value in air, respectively. Other
calibration values and other span values may be used if it can be shown to the
Administrator's satisfaction that equally accurate measurements would be
achieved.
5.2 Particulate Filter.
An in-stack or
an out-of-stack glass fiber filter is recommended if exhaust gas particulate
loading is significant. An out-of-stack filter must be heated to prevent any
condensation unless it can be demonstrated that no condensation occurs.
6. QUALITY CONTROL
6.1 Instrument Quality Control Parameters
Required
instrument quality control parameters are found in the following sections:
6.1.1 The FIA system must be calibrated as specified
in section 7.1.
6.1.2 The system drift check must be performed as
specified in section 7.2.
6.1.3 The system check must be conducted as
specified in section 7.3.
6.2 Audits.
6.2.1 Analysis Audit Procedure.
Immediately
before each test, analyze an audit cylinder as described in section 7.2. The
analysis audit must agree with the audit cylinder concentration within 10
percent.
6.2.2 Audit Samples and Audit Sample Availability.
Audit samples
will be supplied only to enforcement agencies for compliance tests. The
availability of audit samples may be obtained by writing:
Source Test
Audit Coordinator (STAC) (MD-77B)
Quality
Assurance Division
Atmospheric
Research and Exposure Assessment Labortory
U.S.
Environmental Protection Agency
Research
Triangle Park, NC 27711
or by calling
the STAC at (919) 541-7834. The request for the audit sample must be made at
least 30 days prior to the scheduled compliance sample analysis.
6.2.3 Audit Results.
Calculate the
audit sample concentration according to the calculation procedure described in
the audit instructions included with the audit sample. Fill in the audit sample
concentration and the analyst's name on the audit response form included with
the audit instructions. Send one copy to the EPA Regional Office or the
appropriate enforcement agency, and a second copy to the STAC. The EPA Regional
Office or the appropriate enforcement agency will report the results of the
audit to the laboratory being audited. Include this response with the results
of the compliance samples in relevant reports to the EPA Regional Office or the
appropriate enforcement agency.
7. CALIBRATION AND STANDARDIZATION
7.1 FIA Calibration and Linearity Check.
Make necessary
adjustments to the air and fuel supplies for the FIA and ignite the burner.
Allow the FIA to warm up for the period recommended by the manufacturer. Inject
a calibration gas into the measurement system and adjust the back-pressure
regulator to the value required to achieve the flow rates specified by the
manufacturer. Inject the zero- and the high-range calibration gases and adjust
the analyzer calibration to provide the proper responses. Inject the low- and
mid-range gases and record the responses of the measurement system. The
calibration and linearity of the system are acceptable if the responses for all
four gases are within 5 percent of the respective gas values. If the
performance of the system is not acceptable, repair or adjust the system and
repeat the linearity check. Conduct a calibration and linearity check after
assembling the analysis system and after a major change is made to the system.
7.2 Systems Drift Checks.
Select the
calibration gas that most closely approximates the concentration of the
captured emissions for conducting the drift checks. Introduce the zero and
calibration gases at the calibration valve assembly and verify that the
appropriate gas flow rate and pressure are present at the FIA. Record the
measurement system responses to the zero and calibration gases. The performance
of the system is acceptable if the difference between the drift check
measurement and the value obtained in section 7.1 is less than 3 percent of the
span value. Alternatively, recalibrate the FIA as in section 7.1 and report the
results using both sets of calibration data (i.e., data determined prior to the
test period and data determined following the test period). The data that
results in the lowest CE value shall be reported as the results for the test
run. Conduct the system drift checks at the end of each run.
7.3 System Check.
Inject the
high-range calibration gas at the inlet of the sampling probe and record the
response. The performance of the system is acceptable if the measurement system
response is within 5 percent of the value obtained in section 7.1 for the high-range
calibration gas. Conduct a system check before and after each test run.
8. PROCEDURE
8.1. Determination of Volumetric Flow Rate of Captured Emissions
8.1.1 Locate all points where emissions are
captured from the affected facility. Using Method 1, determine the sampling
points. Be sure to check each site for cyclonic or swirling flow.
8.1.2 Measure the velocity at each sampling site
at least once every hour during each sampling run using Method 2 or 2A.
8.2 Determination of VOC Content of Captured Emissions
8.2.1
Analysis Duration. Measure
the VOC responses at each captured emissions point during the entire test run
or, if applicable, while the process is operating. If there are multiple
captured emission locations, design a sampling system to allow a single FIA to
be used to determine the VOC responses at all sampling locations.
8.2.2 Gas VOC
Concentration.
8.2.2.1 Assemble the sample train as shown in
Figure 204B-1. Calibrate the FIA according to the procedure in section 7.1.
8.2.2.2 Conduct a system check according to the
procedure in section 7.3.
8.2.2.3 Install the sample probe so that the probe
is centrally located in the stack, pipe, or duct, and is sealed tightly at the
stack port connection.
8.2.2.4 Inject zero gas at the calibration valve
assembly. Allow the measurement system response to reach zero. Measure the
system response time as the time required for the system to reach the effluent
concentration after the calibration valve has been returned to the effluent
sampling position.
8.2.2.5 Conduct a system check before, and a system
drift check after, each sampling run according to the procedures in sections
7.2 and 7.3. If the drift check following a run indicates unacceptable
performance (see section 7.3), the run is not valid. Alternatively, recalibrate
the FIA as in section 7.1 and report the results using both sets of calibration
data (i.e., data determined prior to the test period and data determined
following the test period). The data that results in the lowest CE value shall
be reported as the results for the test run. The tester may elect to perform
system drift checks during the run not to exceed one drift check per hour.
8.2.2.6 Verify that the sample lines, filter, and
pump temperatures are 120 ± 5ºC.
8.2.2.7 Begin sampling at the start of the test
period and continue to sample during the entire run. Record the starting and
ending times and any required process information as appropriate. If multiple
captured emission locations are sampled using a single FIA, sample at each
location for the same amount of time (e.g., 2 minutes) and continue to switch
from one location to another for the entire test run. Be sure that total
sampling time at each location is the same at the end of the test run. Collect
at least four separate measurements from each sample point during each hour of
testing. Disregard the measurements at each sampling location until two times
the response time of the measurement system has elapsed. Continue sampling for
at least 1 minute and record the concentration measurements.
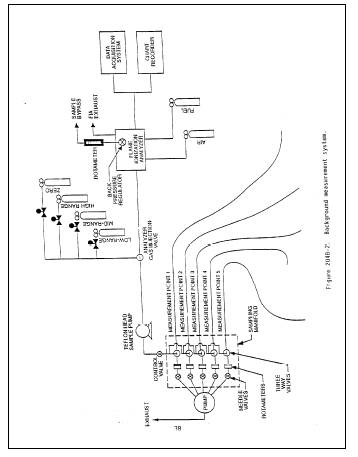
8.2.3
Background Concentration. NOTE: Not
applicable when the building is used as the temporary total enclosure (TTE).
8.2.3.1 Locate all natural draft openings (NDO's)
of the TTE. A sampling point shall be at the center of each NDO, unless
otherwise specified by the Administrator. If there are more than six NDO's,
choose six sampling points evenly spaced among the NDO's.
8.2.3.2 Assemble the sample train as shown in
Figure 204B-2. Calibrate the FIA and conduct a system check according to the
procedures in sections 7.1 and 7.3.
NOTE: This sample train shall be separate from
the sample train used to measure the captured emissions.
8.2.3.3 Position the probe at the sampling
location.
8.2.3.4 Determine the response time, conduct the
system check, and sample according to the procedures described in sections
8.2.2.4 through 8.2.2.7.
8.2.4
Alternative Procedure. The
direct interface sampling and analysis procedure described in section 7.2 of
Method 18 may be used to determine the gas VOC concentration. The system must
be designed to collect and analyze at least one sample every 10 minutes. If the
alternative procedure is used to determine the VOC concentration of the
captured emissions, it must also be used to determine the VOC concentration of
the uncaptured emissions.
9. DATA ANALYSIS AND CALCULATIONS
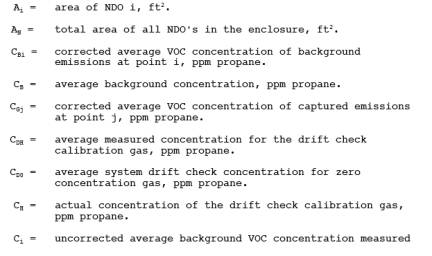
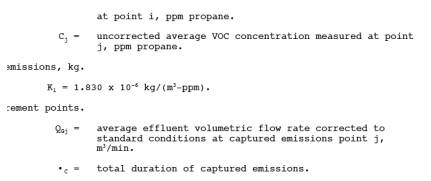
9.1 Nomenclature
9.2 Calculations
9.2.1 Total
VOC Captured Emissions.
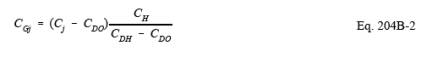
9.2.2 VOC
Concentration of the Captured Emissions at Point j.
9.2.3
Background VOC Concentration at Point i.
![]()
9.2.4 Average
Background Concentration.
NOTE: If the concentration at each point is
within 20 percent of the average concentration of all points, then use the
arithmetic average.
10. METHOD PERFORMANCE.
The measurement
uncertainties are estimated for each captured or uncaptured emissions point as
follows:
Q Gj = ±5.5 percent and CGj = ±5.0 percent. Based on these numbers, the
probable uncertainty for G is estimated at about ±7.4 percent.
11. DIAGRAMS
Figure 204B-1