METHOD 18 -
MEASUREMENT OF GASEOUS ORGANIC COMPOUND EMISSIONS BY GAS CHROMATOGRAPHY
NOTE: This method is not inclusive with respect to
specifications (e.g., equipment and supplies) and procedures (e.g., sampling and
analytical) essential to its performance. Some material is incorporated by
reference from other methods in this part. Therefore, to obtain reliable
results, persons using this method should have a thorough knowledge of at least
the following additional test methods: Method 1, Method 2, Method 3.
NOTE: This method should not be attempted by persons
unfamiliar with the performance characteristics of gas chromatography, nor by
those persons who are unfamiliar with source sampling. Particular care should
be exercised in the area of safety concerning choice of equipment and operation
in potentially explosive atmospheres.
8.0 Sample Collection,
Preservation, Storage, and Transport.
8.2 Final Sampling and
Analysis Procedure.
8.2.1 Integrated Bag
Sampling and Analysis.
8.2.2 Direct Interface
Sampling and Analysis Procedure.
8.2.3 Dilution
Interface Sampling and Analysis Procedure.
8.2.4 Adsorption Tube
Procedure.
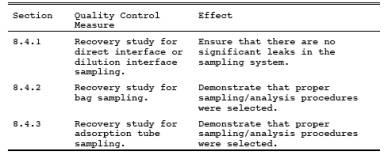
8.4.1 Recovery Study
for Direct Interface or Dilution Interface Sampling.
8.4.2 Recovery Study
for Bag Sampling.
8.4.3 Recovery Study
for Adsorption Tube Sampling.
9.1 Miscellaneous
Quality Control Measures
9.2 Quality Assurance
for Laboratory Procedures.
10.0 Calibration and
Standardization.
10.2 Preparation of
Calibration Curves.
12.0 Data Analysis and
Calculations.
14.0 Pollution
Prevention. [Reserved]
15.0 Waste Management.
[Reserved]
16.1 Optional Presurvey
and Presurvey Sampling.
16.1.4 Determination of
Static Pressure.
16.1.5 Collection of
Presurvey Samples with Adsorption Tube.
18.0 Tables, Diagrams,
Flowcharts, and Validation Data.
1.0 Scope and Application.
1.1 Analyte.
Total gaseous organic
compounds.
1.2 Applicability.
1.2.1 This method is
designed to measure gaseous organics emitted from an industrial source. While
designed for ppm level sources, some detectors are quite capable of detecting
compounds at ambient levels, e.g., ECD, ELCD, and helium ionization detectors.
Some other types of detectors are evolving such that the sensitivity and
applicability may well be in the ppb range in only a few years.
1.2.2 This method
will not determine compounds that (1) are polymeric (high molecular weight),
(2) can polymerize before analysis, or (3) have very low vapor pressures at
stack or instrument conditions.
1.3 Range.
The lower range of
this method is determined by the sampling system; adsorbents may be used to concentrate
the sample, thus lowering the limit of detection below the 1 part per million
(ppm) typically achievable with direct interface or bag sampling. The upper
limit is governed by GC detector saturation or column overloading; the upper
range can be extended by dilution of sample with an inert gas or by using
smaller volume gas sampling loops. The upper limit can also be governed by
condensation of higher boiling compounds.
1.4 Sensitivity.
The sensitivity limit
for a compound is defined as the minimum detectable concentration of that
compound, or the concentration that produces a signal-to-noise ratio of three
to one. The minimum detectable concentration is determined during the presurvey
calibration for each compound.
2.0 Summary of Method.
The major organic
components of a gas mixture are separated by gas chromatography (GC) and
individually quantified by flame ionization, photoionization, electron capture,
or other appropriate detection principles. The retention times of each
separated component are compared with those of known compounds under identical
conditions. Therefore, the analyst confirms the identity and approximate
concentrations of the organic emission components beforehand. With this
information, the analyst then prepares or purchases commercially available
standard mixtures to calibrate the GC under conditions identical to those of
the samples. The analyst also determines the need for sample dilution to avoid
detector saturation, gas stream filtration to eliminate particulate matter, and
prevention of moisture condensation.
3.0 Definitions. [Reserved]
4.0 Interferences.
4.1 Resolution
interferences that may occur can be eliminated by appropriate GC column and
detector choice or by shifting the retention times through changes in the column
flow rate and the use of temperature programming.
4.2 The analytical
system is demonstrated to be essentially free from contaminants by periodically
analyzing blanks that consist of hydrocarbon-free air or nitrogen.
4.3 Sample cross-contamination
that occurs when high-level and low-level samples or standards are analyzed
alternately is best dealt with by thorough purging of the GC sample loop
between samples.
4.4 To assure
consistent detector response, calibration gases are contained in dry air. To
adjust gaseous organic concentrations when water vapor is present in the
sample, water vapor concentrations are determined for those samples, and a
correction factor is applied.
4.5 The gas
chromatograph run time must be sufficient to clear all eluting peaks from the
column before proceeding to the next run (in order to prevent sample
carryover).
5.0 Safety.
5.1 Disclaimer. This
method may involve hazardous materials, operations, and equipment. This test
method may not address all of the safety problems associated with its use. It
is the responsibility of the user of this test method to establish appropriate
safety and health practices and determine the applicability of regulatory
limitations prior to performing this test method. The analyzer users manual
should be consulted for specific precautions to be taken with regard to the
analytical procedure.
6.0 Equipment and Supplies.
6.1 Equipment needed
for the presurvey sampling procedure can be found in Section
16.1.1.
6.2 Equipment needed
for the integrated bag sampling and analysis procedure can be found in Section 8.2.1.1.1.
6.3 Equipment needed
for direct interface sampling and analysis can be found in Section 8.2.2.1.
6.4 Equipment needed
for the dilution interface sampling and analysis can be found in Section 8.2.3.1.
6.5 Equipment needed
for adsorbent tube sampling and analysis can be found in Section
8.2.4.1.
7.0 Reagents and Standards.
7.1 Reagents needed
for the presurvey sampling procedure can be found in Section
16.1.2.
7.2 Quality Assurance
Audit Samples. When making compliance determinations, and upon availability, an
audit sample may be obtained from the appropriate EPA Regional Office or from
the responsible enforcement authority.
NOTE: The responsible enforcement authority should be
notified at least 30 days prior to the test date to allow sufficient time for
sample delivery.
8.0 Sample Collection, Preservation, Storage, and Transport.
8.2 Final Sampling and Analysis Procedure.
Considering safety
(flame hazards) and the source conditions, select an appropriate sampling and
analysis procedure (Section 8.2.1, 8.2.2, 8.2.3 or 8.2.4). In situations where
a hydrogen flame is a hazard and no intrinsically safe GC is suitable, use the
flexible bag collection technique or an adsorption technique.
8.2.1 Integrated Bag Sampling and Analysis.
8.2.1.1
Evacuated Container Sampling Procedure. In this procedure, the bags are filled
by evacuating the rigid air-tight container holding the bags. Use a field
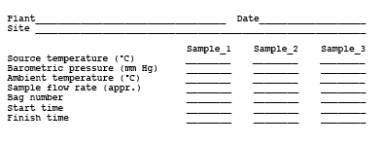
sample data sheet as shown in Figure 18-10. Collect
triplicate samples from each sample location.
8.2.1.1.1 Apparatus.
8.2.1.1.1.1 Probe.
Stainless steel, Pyrex glass, or Teflon tubing probe, according to the duct
temperature, with Teflon tubing of sufficient length to connect to the sample
bag. Use stainless steel or Teflon unions to connect probe and sample line.
8.2.1.1.1.2 Quick
Connects. Male (2) and female (2) of stainless steel construction.
8.2.1.1.1.3 Needle
Valve. To control gas flow.
8.2.1.1.1.4 Pump.
Leakless Teflon-coated diaphragm-type pump or equivalent. To deliver at least 1
liter/min.
8.2.1.1.1.5 Charcoal
Adsorption Tube. Tube filled with activated charcoal, with glass wool plugs at
each end, to adsorb organic vapors.
8.2.1.1.1.6
Flowmeter. O to 500-ml flow range; with manufacturer's calibration curve.
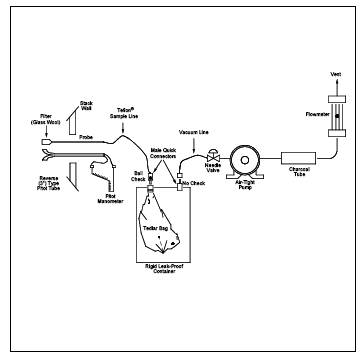
8.2.1.1.2 Sampling
Procedure. To obtain a sample, assemble the sample train as shown in Figure 18-9. Leak-check both the bag and the container.
Connect the vacuum line from the needle valve to the Teflon sample line from
the probe. Place the end of the probe at the centroid of the stack or at a
point no closer to the walls than 1 m, and start the pump. Set the flow rate so
that the final volume of the sample is approximately 80 percent of the bag
capacity. After allowing sufficient time to purge the line several times,
connect the vacuum line to the bag, and evacuate until the rotameter indicates
no flow. Then position the sample and vacuum lines for sampling, and begin the actual
sampling, keeping the rate proportional to the stack velocity. As a precaution,
direct the gas exiting the rotameter away from sampling personnel. At the end
of the sample period, shut off the pump, disconnect the sample line from the
bag, and disconnect the vacuum line from the bag container. Record the source
temperature, barometric pressure, ambient temperature, sampling flow rate, and
initial and final sampling time on the data sheet shown in Figure 18-10.
Protect the Tedlar bag and its container from sunlight. Record the time lapsed
between sample collection and analysis, and then conduct the recovery procedure
in Section 8.4.2.
8.2.1.2 Direct Pump Sampling
Procedure. Follow 8.2.1.1, except place the pump and needle valve between the
probe and the bag. Use a pump and needle valve constructed of inert material
not affected by the stack gas. Leak-check the system, and then purge with stack
gas before connecting to the previously evacuated bag.
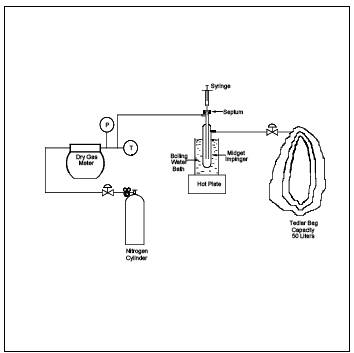
8.2.1.3 Explosion
Risk Area Bag Sampling Procedure. Follow 8.2.1.1 except replace the pump with
another evacuated can (see Figure 18-9a). Use this
method whenever there is a possibility of an explosion due to pumps, heated
probes, or other flame producing equipment.
8.2.1.4 Other
Modified Bag Sampling Procedures. In the event that condensation is observed in
the bag while collecting the sample and a direct interface system cannot be
used, heat the bag during collection, and maintain it at a suitably elevated
temperature during all subsequent operations. (NOTE: Take care to leak-check
the system prior to the dilutions so as not to create a potentially explosive
atmosphere.) As an alternative, collect the sample gas, and simultaneously
dilute it in the Tedlar bag.
8.2.1.4.1 First
Alternative Procedure. Heat the box containing the sample bag to 120 °C (± 5
°C). Then transport the bag as rapidly as possible to the analytical area while
maintaining the heating, or cover the box with an insulating blanket. In the
analytical area, keep the box heated to 120 °C (±5 °C) until analysis. Be sure
that the method of heating the box and the control for the heating circuit are
compatible with the safety restrictions required in each area.
8.2.1.4.2 Second
Alternative Procedure. Prefill the Tedlar bag with a known quantity of inert
gas. Meter the inert gas into the bag according to the procedure for the
preparation of gas concentration standards of volatile liquid materials
(Section 10.1.2.2), but eliminate the midget impinger section. Take the partly
filled bag to the source, and meter the source gas into the bag through heated
sampling lines and a heated flowmeter, or Teflon positive displacement pump.
Verify the dilution factors before sampling each bag through dilution and
analysis of gases of known concentration.
8.2.1.5 Analysis of
Bag Samples.
8.2.1.5.1 Apparatus.
Same as Section 8.1. A minimum of three gas standards are required.
8.2.1.5.2 Procedure.
8.2.1.5.2.1 Establish
proper GC operating conditions as described in Section
10.2, and record all data listed in Figure 18-7. Prepare the GC so that gas
can be drawn through the sample valve. Flush the sample loop with calibration
gas mixture, and activate the valve (sample pressure at the inlet to the GC
introduction valve should be similar during calibration as during actual sample
analysis). Obtain at least three chromatograms for the mixture. The results are
acceptable when the peak areas for the three injections agree to within 5
percent of their average. If they do not agree, run additional samples or
correct the analytical techniques until this requirement is met. Then analyze
the other two calibration mixtures in the same manner. Prepare a calibration
curve as described in Section 10.2.
8.2.1.5.2.2 Analyze
the two field audit samples as described in Section 9.2
by connecting each Tedlar bag containing an audit gas mixture to the sampling
valve. Calculate the results; record and report the data to the audit
supervisor.
8.2.1.5.2.3 Analyze
the three source gas samples by connecting each bag to the sampling valve with
a piece of Teflon tubing identified with that bag. Analyze each bag sample
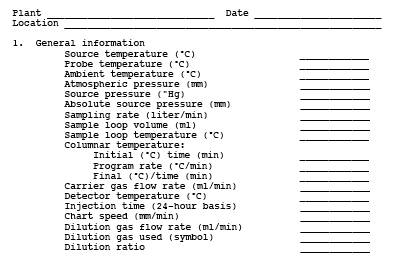
three times. Record the data in Figure 18-11. If
certain items do not apply, use the notation "N.A." If the bag has
been maintained at an elevated temperature as described in Section 8.2.1.4,
determine the stack gas water content by Method 4. After all samples have been
analyzed, repeat the analysis of the mid-level calibration gas for each
compound. Compare the average response factor of the pre- and post-test
analysis for each compound. If they differ by > 5 percent, analyze the other
calibration gas levels for that compound, and prepare a calibration curve using
all the pre- and post-test calibration gas mixture values. If the two response
factor averages (pre- and post-test) differ by less than 5 percent from their
mean value, the tester has the option of using only the pre-test calibration
curve to generate the concentration values.
8.2.1.6 Determination
of Bag Water Vapor Content. Measure the ambient temperature and barometric
pressure near the bag. From a water saturation vapor pressure table, determine
and record the water vapor content of the bag as a decimal figure. (Assume the
relative humidity to be 100 percent unless a lesser value is known.) If the bag
has been maintained at an elevated temperature as described in Section 8.2.1.4,
determine the stack gas water content by Method 4.
8.2.1.7 Audit Gas
Analysis. Immediately prior to the analysis of the stack gas samples, perform
audit analyses as described in Section 9.2.
8.2.1.8 Emission
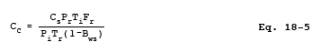
Calculations. From the calibration curve described in Section 8.2.1.5, select
the value of Cs that corresponds to the peak area. Calculate the
concentration Cc in ppm, dry basis, of each organic in the sample
using Equation 18-5 in Section 12.6.
8.2.2 Direct Interface Sampling and Analysis Procedure.
The direct interface
procedure can be used provided that the moisture content of the gas does not
interfere with the analysis procedure, the physical requirements of the
equipment can be met at the site, and the source gas concentration falls within
the linear range of the detector. Adhere to all safety requirements with this
method.
8.2.2.1 Apparatus.
8.2.2.1.1 Probe.
Constructed of stainless steel, Pyrex glass, or Teflon tubing as dictated by
duct temperature and reactivity of target compounds. A filter or glass wool
plug may be needed if particulate is present in the stack gas. If necessary,
heat the probe with heating tape or a special heating unit capable of
maintaining a temperature greater than 110°C.
8.2.2.1.2 Sample
Lines. 6.4-mm OD (or other diameter as needed) Teflon lines, heat-traced to
prevent condensation of material (greater than 110°C).
8.2.2.1.3 Quick
Connects. To connect sample line to gas sampling valve on GC instrument and to
pump unit used to withdraw source gas. Use a quick connect or equivalent on the
cylinder or bag containing calibration gas to allow connection of the
calibration gas to the gas sampling valve.
8.2.2.1.4
Thermocouple Readout Device. Potentiometer or digital thermometer, to measure
source temperature and probe temperature.
8.2.2.1.5 Heated Gas
Sampling Valve. Of two-position, six-port design, to allow sample loop to be
purged with source gas or to direct source gas into the GC instrument.
8.2.2.1.6 Needle
Valve. To control gas sampling rate from the source.
8.2.2.1.7 Pump.
Leakless Teflon-coated diaphragm-type pump or equivalent, capable of at least 1
liter/minute sampling rate.
8.2.2.1.8 Flowmeter.
Of suitable range to measure sampling rate.
8.2.2.1.9 Charcoal
Adsorber. To adsorb organic vapor vented from the source to prevent exposure of
personnel to source gas.
8.2.2.1.10 Gas
Cylinders. Carrier gas, oxygen and fuel as needed to run GC and detector.
8.2.2.1.11 Gas
Chromatograph. Capable of being moved into the field, with detector, heated gas
sampling valve, column required to complete separation of desired components,
and option for temperature programming.
8.2.2.1.12
Recorder/Integrator. To record results.
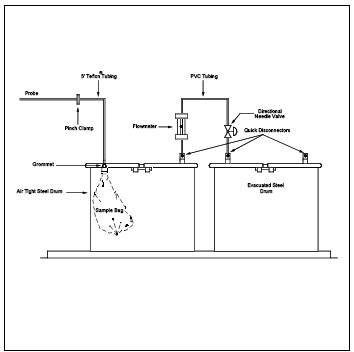
8.2.2.2 Procedure.
Calibrate the GC using the procedures in Section 8.2.1.5.2.1. To obtain a stack
gas sample, assemble the sampling system as shown in Figure
18-12. Make sure all connections are tight. Turn on the probe and sample
line heaters. As the temperature of the probe and heated line approaches the
target temperature as indicated on the thermocouple readout device, control the
heating to maintain a temperature greater than 110°C. Conduct a 3-point
calibration of the GC by analyzing each gas mixture in triplicate. Generate a
calibration curve. Place the inlet of the probe at the centroid of the duct, or
at a point no closer to the walls than 1 m, and draw source gas into the probe,
heated line, and sample loop. After thorough flushing, analyze the stack gas
sample using the same conditions as for the calibration gas mixture. For each
run, sample, analyze, and record five consecutive samples. A test consists of three
runs (five samples per run times three runs, for a total of fifteen samples).
After all samples have been analyzed, repeat the analysis of the mid-level
calibration gas for each compound. For each calibration standard, compare the
pre- and post-test average response factors (RF) for each compound. If the two
calibration RF values (pre and post-analysis) differ by more than 5 percent
from their mean value, then analyze the other calibration gas levels for that
compound and determine the stack gas sample concentrations by comparison to
both calibration curves (this is done by preparing a calibration curve using
all the pre and post-test calibration gas mixture values). If the two
calibration RF values differ by less than 5 percent from their mean value, the
tester has the option of using only the pre-test calibration curve to generate
the concentration values. Record this calibration data and the other required
data on the data sheet shown in Figure 18-11, deleting
the dilution gas information. (NOTE: Take care to draw all samples, calibration
mixtures, and audits through the sample loop at the same pressure.)
8.2.2.3 Determination
of Stack Gas Moisture Content. Use Method 4 to
measure the stack gas moisture content.
8.2.2.4 Quality
Assurance. Same as Section 8.2.1.7. Introduce the audit gases in the sample
line immediately following the probe.
8.2.2.5 Emission
Calculations. Same as Section 8.2.1.8.
8.2.3 Dilution Interface Sampling and Analysis Procedure.
Source samples that
contain a high concentration of organic materials may require dilution prior to
analysis to prevent saturating the GC detector. The apparatus required for this
direct interface procedure is basically the same as that described in the
Section 8.2.2, except a dilution system is added between the heated sample line
and the gas sampling valve. The apparatus is arranged so that either a 10:1 or
100:1 dilution of the source gas can be directed to the chromatograph. A pump of
larger capacity is also required, and this pump must be heated and placed in
the system between the sample line and the dilution apparatus.
8.2.3.1 Apparatus.
The equipment required in addition to that specified for the direct interface
system is as follows:
8.2.3.1.1 Sample
Pump. Leakless Teflon-coated diaphragm-type that can withstand being heated to
120°C and deliver 1.5 liters/minute.
8.2.3.1.2 Dilution
Pumps. Two Model A-150 Komhyr Teflon positive displacement type delivering 150
cc/minute, or equivalent. As an option, calibrated flowmeters can be used in
conjunction with Teflon-coated diaphragm pumps.
8.2.3.1.3 Valves. Two
Teflon three-way valves, suitable for connecting to Teflon tubing.
8.2.3.1.4 Flowmeters.
Two, for measurement of diluent gas.
8.2.3.1.5 Diluent Gas
with Cylinders and Regulators. Gas can be nitrogen or clean dry air, depending
on the nature of the source gases.
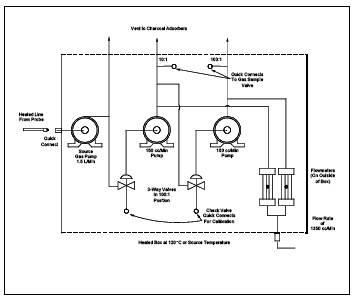
8.2.3.1.6 Heated Box.
Suitable for being heated to 120°C, to contain the three pumps, three-way
valves, and associated connections. The box should be equipped with quick
connect fittings to facilitate connection of: (1) the heated sample line from
the probe, (2) the gas sampling valve, (3) the calibration gas mixtures, and
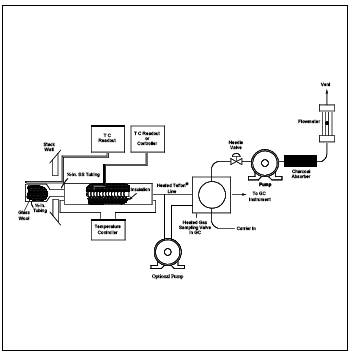
(4) diluent gas lines. A schematic diagram of the components and connections is
shown in Figure 18-13. The heated box shown in Figure
18-13 is designed to receive a heated line from the probe. An optional design
is to build a probe unit that attaches directly to the heated box. In this way,
the heated box contains the controls for the probe heaters, or, if the box is
placed against the duct being sampled, it may be possible to eliminate the
probe heaters. In either case, a heated Teflon line is used to connect the
heated box to the gas sampling valve on the chromatograph.
NOTE: Care must be taken to leak-check the system
prior to the dilutions so as not to create a potentially explosive atmosphere.
8.2.3.2 Procedure.
8.2.3.2.1 Assemble the
apparatus by connecting the heated box, shown in Figure 18-13, between the
heated sample line from the probe and the gas sampling valve on the
chromatograph. Vent the source gas from the gas sampling valve directly to the
charcoal filter, eliminating the pump and rotameter. Heat the sample probe,
sample line, and heated box. Insert the probe and source thermocouple at the
centroid of the duct, or to a point no closer to the walls than 1 m. Measure
the source temperature, and adjust all heating units to a temperature 0 to 3°C
above this temperature. If this temperature is above the safe operating
temperature of the Teflon components, adjust the heating to maintain a
temperature high enough to prevent condensation of water and organic compounds
(greater than 110°C). Calibrate the GC through the dilution system by following
the procedures in Section 8.2.1.5.2.1. Determine the concentration of the
diluted calibration gas using the dilution factor and the certified
concentration of the calibration gas. Record the pertinent data on the data
sheet shown in Figure 18-11.
8.2.3.2.2 Once the
dilution system and GC operations are satisfactory, proceed with the analysis
of source gas, maintaining the same dilution settings as used for the
standards.
8.2.3.2.3 Analyze the
audit samples using either the dilution system, or directly connect to the gas
sampling valve as required. Record all data and report the results to the audit
supervisor.
8.2.3.3 Determination
of Stack Gas Moisture Content. Same as Section 8.2.2.3.
8.2.3.4 Quality
Assurance. Same as Section 8.2.2.4.
8.2.3.5 Emission
Calculations. Same as section 8.2.2.5, with the dilution factor applied.
8.2.4 Adsorption Tube Procedure.
Any commercially
available adsorbent is allowed for the purposes of this method, as long as the
recovery study criteria in Section 8.4.3 are met.
Help in choosing the adsorbent may be found by calling the distributor, or the
tester may refer to National Institute for Occupational Safety and Health (NIOSH)
methods for the particular organics to be sampled. For some adsorbents, the
principal interferent will be water vapor. If water vapor is thought to be a
problem, the tester may place a midget impinger in an ice bath before the
adsorbent tubes. If this option is chosen, the water catch in the midget
impinger shall be analyzed for the target compounds. Also, the spike for the
recovery study (in Section 8.4.3) shall be conducted in both the midget
impinger and the adsorbent tubes. The combined recovery (add the recovered
amount in the impinger and the adsorbent tubes to calculate R) shall then meet
the criteria in Section 8.4.3. NOTE: Post-test leak-checks are not allowed for this technique since this
can result in sample contamination.
8.2.4.1 Additional
Apparatus. The following items (or equivalent) are suggested.
8.2.4.1.1 Probe.
Borosilicate glass or stainless steel, approximately 6-mm ID, with a heating
system if water condensation is a problem, and a filter (either in-stack or
out-of-stack, heated to stack temperature) to remove particulate matter. In
most instances, a plug of glass wool is a satisfactory filter.
8.2.4.1.2 Flexible
Tubing. To connect probe to adsorption tubes. Use a material that exhibits
minimal sample adsorption.
8.2.4.1.3 Leakless
Sample Pump. Flow controlled, constant rate pump, with a set of limiting
(sonic) orifices.
8.2.4.1.4 Bubble-Tube
Flowmeter. Volume accuracy within 1 percent, to calibrate pump.
8.2.4.1.5 Stopwatch.
To time sampling and pump rate calibration.
8.2.4.1.6 Adsorption
Tubes. Precleaned adsorbent, with mass of adsorbent to be determined by
calculating breakthrough volume and expected concentration in the stack.
8.2.4.1.7 Barometer. Accurate
to 5 mm Hg, to measure atmospheric pressure during sampling and pump
calibration.
8.2.4.1.8 Rotameter.
O to 100 cc/min, to detect changes in flow rate during sampling.
8.2.4.2 Sampling and
Analysis.
8.2.4.2.1 Calibrate
the pump and limiting orifice flow rate through adsorption tubes with the
bubble tube flowmeter before sampling. The sample system can be operated as a
"recirculating loop" for this operation. Record the ambient
temperature and barometric pressure. Then, during sampling, use the rotameter
to verify that the pump and orifice sampling rate remains constant.
8.2.4.2.2 Use a
sample probe, if required, to obtain the sample at the centroid of the duct, or
at a point no closer to the walls than 1 m. Minimize the length of flexible
tubing between the probe and adsorption tubes. Several adsorption tubes can be
connected in series, if the extra adsorptive capacity is needed. Adsorption
tubes should be maintained vertically during the test in order to prevent
channeling. Provide the gas sample to the sample system at a pressure
sufficient for the limiting orifice to function as a sonic orifice. Record the
total time and sample flow rate (or the number of pump strokes), the barometric
pressure, and ambient temperature. Obtain a total sample volume commensurate
with the expected concentration(s) of the volatile organic(s) present, and
recommended sample loading factors (weight sample per weight adsorption media).
Laboratory tests prior to actual sampling may be necessary to predetermine this
volume. If water vapor is present in the sample at concentrations above 2 to 3
percent, the adsorptive capacity may be severely reduced. Operate the gas
chromatograph according to the manufacturer's instructions. After establishing
optimum conditions, verify and document these conditions during all operations.
Calibrate the instrument. Analyze the audit samples (see Section 16.1.4.3),
then the emission samples.
8.2.4.3 Standards and
Calibration. If using thermal desorption, obtain calibration gases using the procedures
in Section 10.1. If using solvent extraction, prepare liquid standards in the
desorption solvent. Use a minimum of three different standards; select the
concentrations to bracket the expected average sample concentration. Perform
the calibration before and after each day's sample analyses using the
procedures in Section 8.2.1.5.2.1.
8.2.4.4 Quality
Assurance.
8.2.4.4.1 Determine
the recovery efficiency of the pollutants of interest according to Section
8.4.3.
8.2.4.4.2
Determination of Sample Collection Efficiency (Optional). If sample
breakthrough is thought to be a problem, a routine procedure for determining
breakthrough is to analyze the primary and backup portions of the adsorption
tubes separately. If the backup portion exceeds 10 percent of the total amount
(primary and back-up), it is usually a sign of sample breakthrough. For the
purposes of this method, only the recovery efficiency value (Section 8.4.3) is
used to determine the appropriateness of the sampling and analytical procedure.
8.2.4.4.3 Volume Flow
Rate Checks. Perform this check immediately after sampling with all sampling
train components in place. Use the bubble-tube flowmeter to measure the pump
volume flow rate with the orifice used in the test sampling, and record the result.
If it has changed by more than 5 but less than 20 percent, calculate an average
flow rate for the test. If the flow rate has changed by more than 20 percent,
recalibrate the pump and repeat the sampling.
8.2.4.4.4
Calculations. Correct all sample volumes to standard conditions. If a sample
dilution system has been used, multiply the results by the appropriate dilution
ratio. Correct all results according to the applicable procedure in Section
8.4.3. Report results as ppm by volume, dry basis.
8.3 Reporting of Results.
At the completion of
the field analysis portion of the study, ensure that the data sheets shown in
Figure 18-11 have been completed. Summarize this data on the data sheets shown
in Figure 18-15.
8.4 Recovery Study.
After conducting the
presurvey and identifying all of the pollutants of interest, conduct the
appropriate recovery study during the test based on the sampling system chosen
for the compounds of interest.
8.4.1 Recovery Study for Direct Interface or Dilution Interface Sampling.
If the procedures in
Section 8.2.2 or 8.2.3 are to be used to analyze the stack gas, conduct the
calibration procedure as stated in Section 8.2.2.2 or 8.2.3.2, as appropriate.
Upon successful completion of the appropriate calibration procedure, attach the
mid-level calibration gas for at least one target compound to the inlet of the
probe or as close as possible to the inlet of the probe, but before the filter.
Repeat the calibration procedure by sampling and analyzing the mid-level
calibration gas through the entire sampling and analytical system in
triplicate. The mean of the calibration gas response sampled through the probe
shall be within 10 percent of the analyzer response. If the difference in the
two means is greater than 10 percent, check for leaks throughout the sampling
system and repeat the analysis of the standard through the sampling system
until this criterion is met.
8.4.2 Recovery Study for Bag Sampling.
8.4.2.1 Follow the procedures
for the bag sampling and analysis in Section 8.2.1. After analyzing all three
bag samples, choose one of the bag samples and tag this bag as the spiked bag.
Spike the chosen bag sample with a known mixture (gaseous or liquid) of all of
the target pollutants. The theoretical concentration, in ppm, of each spiked
compound in the bag shall be 40 to 60 percent of the average concentration
measured in the three bag samples. If a target compound was not detected in the
bag samples, the concentration of that compound to be spiked shall be 5 times
the limit of detection for that compound. Store the spiked bag for the same
period of time as the bag samples collected in the field. After the appropriate
storage time has passed, analyze the spiked bag three times. Calculate the
average fraction recovered (R) of each spiked target compound with the equation
in Section 12.7.
8.4.2.2 For the bag
sampling technique to be considered valid for a compound, 0.70 ≤R ≤1.30. If the
R value does not meet this criterion for a target compound, the sampling
technique is not acceptable for that compound, and therefore another sampling
technique shall be evaluated for acceptance (by repeating the recovery study
with another sampling technique). Report the R value in the test report and
correct all field measurements with the calculated R value for that compound by
using the equation in Section 12.8.
8.4.3 Recovery Study for Adsorption Tube Sampling.
If following the
adsorption tube procedure in Section 8.2.4, conduct a recovery study of the
compounds of interest during the actual field test. Set up two identical
sampling trains. Collocate the two sampling probes in the stack. The probes
shall be placed in the same horizontal plane, where the first probe tip is 2.5
cm from the outside edge of the other. One of the sampling trains shall be
designated the spiked train and the other the unspiked train. Spike all of the
compounds of interest (in gaseous or liquid form) onto the adsorbent tube(s) in
the spiked train before sampling. The mass of each spiked compound shall be 40
to 60 percent of the mass expected to be collected with the unspiked train.
Sample the stack gas into the two trains simultaneously. Analyze the adsorbents
from the two trains utilizing identical analytical procedures and
instrumentation. Determine the fraction of spiked compound recovered (R) using
the equations in Section 12.9.
8.4.3.1 Repeat the
procedure in Section 8.4.3 twice more, for a total of three runs. In order for
the adsorbent tube sampling and analytical procedure to be acceptable for a
compound, 0.70 ≤R ≤1.30 (R in this case is the average of three runs). If the
average R value does not meet this criterion for a target compound, the sampling
technique is not acceptable for that compound, and therefore another sampling
technique shall be evaluated for acceptance (by repeating the recovery study
with another sampling technique). Report the R value in the test report and
correct all field measurements with the calculated R value for that compound by
using the equation in Section 12.8.
9.0 Quality Control.
9.1 Miscellaneous Quality Control Measures
9.2 Quality Assurance for Laboratory Procedures.
Immediately after the
preparation of the calibration curves, the analysis audit described in 40 CFR
Part 61, Appendix C, Procedure 2: "Procedure for Field Auditing GC
Analysis," should be performed if audit materials are available. The
information required to document the analysis of the audit samples has been
included on the example data sheets shown in Figures 18-3 and 18-7. The audit
analyses should agree with the certified audit concentrations within 10
percent. Audit sample results shall be submitted according to directions
provided with the audit samples.
10.0 Calibration and Standardization.
10.1 Calibration Standards.
Obtain calibration
gas standards for each target compound to be analyzed. Commercial cylinder
gases certified by the manufacturer to be accurate to within 1 percent of the
certified label value are preferable, although cylinder gases certified by the
manufacturer to 2 percent accuracy are allowed. Another option allowed by this
method is for the tester to obtain high concentration certified cylinder gases
and then use a dilution system meeting the requirements of Test Method 205, 40
CFR Part 51, Appendix M to make multi-level calibration gas standards. Prepare
or obtain enough calibration standards so that there are three different
concentrations of each organic compound expected to be measured in the source
sample. For each organic compound, select those concentrations that bracket the
concentrations expected in the source samples. A calibration standard may
contain more than one organic compound. If samples are collected in adsorbent
tubes and extracted using solvent extraction, prepare or obtain standards in
the same solvent used for the sample extraction procedure. Verify the stability
of all standards for the time periods they are used.
10.2 Preparation of Calibration Curves.
10.2.1 Establish
proper GC conditions, then flush the sampling loop for 30 seconds. Allow the
sample loop pressure to equilibrate to atmospheric pressure, and activate the
injection valve. Record the standard concentration, attenuator factor, injection
time, chart speed, retention time, peak area, sample loop temperature, column
temperature, and carrier gas flow rate. Analyze each standard in triplicate.
10.2.2 Repeat this
procedure for each standard. Prepare a graphical plot of concentration (Cs) versus the calibration area values. Perform a regression
analysis, and draw the least square line.
11.0 Analytical Procedures.
11.1 Analysis
Development.
11.1.1 Selection of
GC Parameters.
11.1.1.1 Column Choice.
Based on the initial contact with plant personnel concerning the plant process
and the anticipated emissions, choose a column that provides good resolution
and rapid analysis time. The choice of an appropriate column can be aided by a
literature search, contact with manufacturers of GC columns, and discussion
with personnel at the emission source.
NOTE: Most column manufacturers keep excellent records
on their products. Their technical service departments may be able to recommend
appropriate columns and detector type for separating the anticipated compounds,
and they may be able to provide information on interferences, optimum operating
conditions, and column limitations. Plants with analytical laboratories may be
able to provide information on their analytical procedures.
11.1.1.2 Preliminary
GC Adjustment. Using the standards and column obtained in Section 11.1.1.1,
perform initial tests to determine appropriate GC conditions that provide good
resolution and minimum analysis time for the compounds of interest.
11.1.1.3 Preparation
of Presurvey Samples. If the samples were collected on an adsorbent, extract
the sample as recommended by the manufacturer for removal of the compounds with
a solvent suitable to the type of GC analysis. Prepare other samples in an
appropriate manner.
11.1.1.4 Presurvey
Sample Analysis.
11.1.1.4.1 Before
analysis, heat the presurvey sample to the duct temperature to vaporize any
condensed material. Analyze the samples by the GC procedure, and compare the
retention times against those of the calibration samples that contain the
components expected to be in the stream. If any compounds cannot be identified
with certainty by this procedure, identify them by other means such as GC/mass
spectroscopy (GC/MS) or GC/infrared techniques. A GC/MS system is recommended.
11.1.1.4.2 Use the GC
conditions determined by the procedure of Section 11.1.1.2 for the first
injection. Vary the GC parameters during subsequent injections to determine the
optimum settings. Once the optimum settings have been determined, perform
repeat injections of the sample to determine the retention time of each
compound. To inject a sample, draw sample through the loop at a constant rate
(100 ml/min for 30 seconds). Be careful not to pressurize the gas in the loop.
Turn off the pump and allow the gas in the sample loop to come to ambient
pressure. Activate the sample valve, and record injection time, loop
temperature, column temperature, carrier flow rate, chart speed, and attenuator
setting. Calculate the retention time of each peak using the distance from
injection to the peak maximum divided by the chart speed. Retention times
should be repeatable within O.5 seconds.
11.1.1.4.3 If the
concentrations are too high for appropriate detector response, a smaller sample
loop or dilutions may be used for gas samples, and, for liquid samples,
dilution with solvent is appropriate. Use the standard curves (Section 10.2) to
obtain an estimate of the concentrations.
11.1.1.4.4 Identify
all peaks by comparing the known retention times of compounds expected to be in
the retention times of peaks in the sample. Identify any remaining unidentified
peaks which have areas larger than 5 percent of the total using a GC/MS, or
estimation of possible compounds by their retention times compared to known
compounds, with confirmation by further GC analysis.
12.0 Data Analysis and Calculations.
12.1 Nomenclature.
Bws = Water vapor content of the bag sample or stack
gas, proportion by volume.
Cs = Concentration of the organic from the calibration curve, ppm.
Gv = Gas volume or organic compound injected, ml.
Lv = Liquid volume of organic injected,µl.
M = Molecular weight
of organic, g/g-mole.
ms = Total mass of compound measured on adsorbent with spiked train
(µg).
mu = Total mass of compound measured on adsorbent with unspiked train
(µg).
mv = Mass per volume of spiked compound measured (µg/L).
Pi = Barometric or absolute sample loop pressure at time of sample
analysis, mm Hg.
Pm = Absolute pressure of dry gas meter, mm Hg.
Pr = Reference pressure, the barometric pressure or absolute sample
loop pressure recorded during calibration, mm Hg.
Ps = Absolute pressure of syringe before injection, mm Hg.
qc = Flow rate of the calibration gas to be diluted.
qc1 = Flow rate of the calibration gas to be diluted
in stage 1.
qc2 = Flow rate of the calibration gas to be diluted
in stage 2.
qd = Diluent gas flow rate.
qd1 = Flow rate of diluent gas in stage 1.
qd2 = Flow rate of diluent gas in stage 2.
s = Theoretical
concentration (ppm) of spiked target compound in the bag.
S = Theoretical mass
of compound spiked onto adsorbent in spiked train (µg).
t = Measured average
concentration (ppm) of target compound and source sample (analysis results
subsequent to bag spiking)
Ti = Sample loop temperature at the time of sample analysis, °K.
Tm = Absolute temperature of dry gas meter, °K.
Ts = Absolute temperature of syringe before injection, °K.
u = Source sample
average concentration (ppm) of target compound in the bag (analysis results
before bag spiking).
Vm = Gas volume indicated by dry gas meter, liters.
vs = volume of stack gas sampled with spiked train (L).
vu = volume of stack gas sampled with unspiked train (L).
X = Mole or volume fraction
of the organic in the calibration gas to be diluted.
Y = Dry gas meter
calibration factor, dimensionless.
µl = Liquid organic
density as determined, g/ml.
24.055 = Ideal gas
molar volume at 293 °K and 760 mm Hg, liters/g-mole.
1000 = Conversion factor,
ml/liter.
106 = Conversion to ppm.
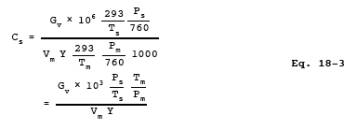
12.2 Calculate the
concentration, Cs, in ppm using the following equation:
![]()
12.3 Calculate the
concentration, Cs, in ppm of the organic in the final gas mixture
using the following equation:
![]()
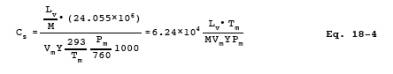
12.4 Calculate each
organic standard concentration, Cs, in ppm
using the following equation:
12.5 Calculate each
organic standard concentration, Cs, in ppm
using the following equation:
12.6
Calculate the concentration, Cc, in ppm, dry basis,
of each organic is the sample using the following equation:
12.7 Calculate the
average fraction recovered (R) of each spiked target compound using the
following equation:
![]()
12.8
Correct all field measurements with the calculated R value for that compound
using the following equation:
![]()
12.9
Determine the mass per volume of spiked compound measured using the following
equation:
![]()
12.10 Calculate the
fraction of spiked compound recovered, R, using the following equation:
![]()
13.0 Method Performance.
13.1 Since a
potential sample may contain a variety of compounds from various sources, a
specific precision limit for the analysis of field samples is impractical. Precision
in the range of 5 to 10 percent relative standard deviation (RSD) is typical
for gas chromatographic techniques, but an experienced GC operator with a
reliable instrument can readily achieve 5 percent RSD. For this method, the
following combined GC/operator values are required.
(a) Precision.
Triplicate analyses of calibration standards fall within 5 percent of their
mean value. (b) Accuracy. Analysis results of prepared audit samples are within
10 percent of preparation values. (c) Recovery. After developing an appropriate
sampling and analytical system for the pollutants of interest, conduct the
procedure in Section 8.4. Conduct the appropriate
recovery study in Section 8.4 at each sampling point where the method is being
applied. Submit the data and results of the recovery procedure with the
reporting of results under Section 8.3.
14.0 Pollution Prevention. [Reserved]
15.0 Waste Management. [Reserved]
16.0 Alternative Procedures.
16.1 Optional Presurvey and Presurvey Sampling.
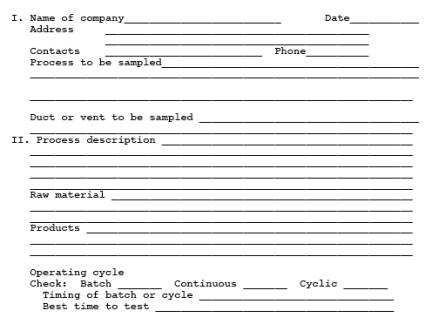
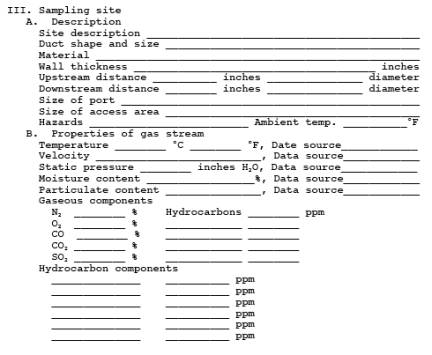
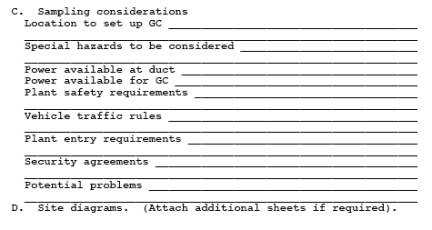
NOTE: Presurvey screening is optional. Presurvey
sampling should be conducted for sources where the target pollutants are not
known from previous tests and/or process knowledge. Perform a presurvey for
each source to be tested. Refer to Figure 18-1. Some of
the information can be collected from literature surveys and source personnel.
Collect gas samples that can be analyzed to confirm the identities and
approximate concentrations of the organic emissions.
16.1.1 Apparatus.
This apparatus list
also applies to Sections 8.2 and 11.
16.1.1.1 Teflon
Tubing. (Mention of trade names or specific products does not constitute
endorsement by the U.S. Environmental Protection Agency.) Diameter and length
determined by connection requirements of cylinder regulators and the GC.
Additional tubing is necessary to connect the GC sample loop to the sample.
16.1.1.2 Gas
Chromatograph. GC with suitable detector, columns, temperature-controlled
sample loop and valve assembly, and temperature programmable oven, if
necessary. The GC shall achieve sensitivity requirements for the compounds
under study.
16.1.1.3 Pump.
Capable of pumping 100 ml/min. For flushing sample loop.
16.1.1.4 Flow Meter.
To measure flow rates.
16.1.1.5 Regulators.
Used on gas cylinders for GC and for cylinder standards.
16.1.1.6 Recorder.
Recorder with linear strip chart is minimum acceptable. Integrator (optional)
is recommended.
16.1.1.7 Syringes.
0.5-ml, 1.O- and 10-microliter size, calibrated, maximum accuracy (gas tight)
for preparing calibration standards. Other appropriate sizes can be used.
16.1.1.8 Tubing
Fittings. To plumb GC and gas cylinders.
16.1.1.9 Septa. For
syringe injections.
16.1.1.10 Glass Jars.
If necessary, clean, colored glass jars with Teflon-lined lids for condensate
sample collection. Size depends on volume of condensate.
16.1.1.11 Soap Film
Flowmeter. To determine flow rates.
16.1.1.12 Tedlar
Bags. 10- and 50-liter capacity, for preparation of standards.
16.1.1.13 Dry Gas
Meter with Temperature and Pressure Gauges. Accurate to ± 2 percent, for
preparation of gas standards.
16.1.1.14 Midget
Impinger/Hot Plate Assembly. For preparation of gas standards.
16.1.1.15 Sample
Flasks. For presurvey samples, must have gas-tight seals.
16.1.1.16 Adsorption
Tubes. If necessary, blank tubes filled with necessary adsorbent (charcoal,
Tenax, XAD-2, etc.) for presurvey samples.
16.1.1.17 Personnel
Sampling Pump. Calibrated, for collecting adsorbent tube presurvey samples.
16.1.1.18 Dilution
System. Calibrated, the dilution system is to be constructed following the
specifications of an acceptable method.
16.1.1.19 Sample
Probes. Pyrex or stainless steel, of sufficient length to reach centroid of
stack, or a point no closer to the walls than 1 m.
16.1.1.20 Barometer.
To measure barometric pressure.
16.1.2 Reagents.
16.1.2.1 Water.
Deionized distilled.
16.1.2.2 Methylene
chloride.
16.1.2.3 Calibration
Gases. A series of standards prepared for every compound of interest.
16.1.2.4 Organic
Compound Solutions. Pure (99.9 percent), or as pure as can reasonably be
obtained, liquid samples of all the organic compounds needed to prepare calibration
standards.
16.1.2.5 Extraction
Solvents. For extraction of adsorbent tube samples in preparation for analysis.
16.1.2.6 Fuel. As
recommended by the manufacturer for operation of the GC.
16.1.2.7 Carrier Gas.
Hydrocarbon free, as recommended by the manufacturer for operation of the
detector and compatibility with the column.
16.1.2.8 Zero Gas.
Hydrocarbon free air or nitrogen, to be used for dilutions, blank preparation,
and standard preparation.
16.1.3 Sampling.
16.1.3.1 Collection
of Samples with Glass Sampling Flasks. Presurvey samples may be collected in
precleaned 250-ml double-ended glass sampling flasks. Teflon stopcocks, without
grease, are preferred. Flasks should be cleaned as follows: Remove the
stopcocks from both ends of the flasks, and wipe the parts to remove any
grease. Clean the stopcocks, barrels, and receivers with methylene chloride (or
other non-target pollutant solvent, or heat and humidified air). Clean all
glass ports with a soap solution, then rinse with tap and deionized distilled
water. Place the flask in a cool glass annealing furnace, and apply heat up to
500°C. Maintain at this temperature for 1 hours. After this time period, shut
off and open the furnace to allow the flask to cool. Return the stopcocks to
the flask receivers. Purge the assembly with high-purity nitrogen for 2 to 5
minutes. Close off the stopcocks after purging to maintain a slight positive
nitrogen pressure. Secure the stopcocks with tape. Presurvey samples can be
obtained either by drawing the gases into the previously evacuated flask or by
drawing the gases into and purging the flask with a rubber suction bulb.
16.1.3.1.1 Evacuated
Flask Procedure. Use a high-vacuum pump to evacuate the flask to the capacity
of the pump; then close off the stopcock leading to the pump. Attach a 6-mm
outside diameter (OD) glass tee to the flask inlet with a short piece of Teflon
tubing. Select a 6-mm OD borosilicate sampling probe, enlarged at one end to a
12-mm OD and of sufficient length to reach the centroid of the duct to be
sampled. Insert a glass wool plug in the enlarged end of the probe to remove
particulate matter. Attach the other end of the probe to the tee with a short
piece of Teflon tubing. Connect a rubber suction bulb to the third leg of the
tee. Place the filter end of the probe at the centroid of the duct, and purge
the probe with the rubber suction bulb. After the probe is completely purged
and filled with duct gases, open the stopcock to the grab flask until the
pressure in the flask reaches duct pressure. Close off the stopcock, and remove
the probe from the duct. Remove the tee from the flask and tape the stopcocks
to prevent leaks during shipment. Measure and record the duct temperature and
pressure.
16.1.3.1.2 Purged
Flask Procedure. Attach one end of the sampling flask to a rubber suction bulb.
Attach the other end to a 6-mm OD glass probe as described in Section
8.3.3.1.1. Place the filter end of the probe at the centroid of the duct, or at
a point no closer to the walls than 1 m, and apply suction with the bulb to
completely purge the probe and flask. After the flask has been purged, close
off the stopcock near the suction bulb, and then close off the stopcock near
the probe. Remove the probe from the duct, and disconnect both the probe and suction
bulb. Tape the stopcocks to prevent leakage during shipment. Measure and record
the duct temperature and pressure.
16.1.3.2 Flexible Bag
Procedure. Tedlar or aluminized Mylar bags can also be used to obtain the
presurvey sample. Use new bags, and leak-check them before field use. In
addition, check the bag before use for contamination by filling it with
nitrogen or air, and analyzing the gas by GC at high sensitivity. Experience
indicates that it is desirable to allow the inert gas to remain in the bag
about 24 hours or longer to check for desorption of organics from the bag.
Follow the leak-check and sample collection procedures given in Section 8.2.1.
16.1.3.3
Determination of Moisture Content. For combustion or water- controlled processes,
obtain the moisture content from plant personnel or by measurement during the
presurvey. If the source is below 59°C, measure the wet bulb and dry bulb
temperatures, and calculate the moisture content using a psychrometric chart.
At higher temperatures, use Method 4 to determine the moisture content.
16.1.4 Determination of Static Pressure.
Obtain the static
pressure from the plant personnel or measurement. If a type S pitot tube and an
inclined manometer are used, take care to align the pitot tube 90° from the
direction of the flow. Disconnect one of the tubes to the manometer, and read
the static pressure; note whether the reading is positive or negative.
16.1.5 Collection of Presurvey Samples with Adsorption Tube.
Follow Section 8.2.4 for presurvey sampling.
17.0 References.
1. American Society
for Testing and Materials. C1 Through C5 Hydrocarbons in the Atmosphere by Gas
Chromatography. ASTM D 2820-72, Part 23. Philadelphia, Pa. 23:950-958. 1973.
2. Corazon, V.V.
Methodology for Collecting and Analyzing Organic Air Pollutants. U.S.
Environmental Protection Agency. Research Triangle Park, N.C. Publication No.
EPA-600/2-79-042. February 1979.
3. Dravnieks, A.,
B.K. Krotoszynski, J. Whitfield, A. O'Donnell, and T. Burgwald. Environmental
Science and Technology. 5(12):1200-1222. 1971.
4. Eggertsen, F.T.,
and F.M. Nelsen. Gas Chromatographic Analysis of Engine Exhaust and Atmosphere.
Analytical Chemistry. 30(6): 1040-1043. 1958.
5. Feairheller, W.R.,
P.J. Marn, D.H. Harris, and D.L. Harris. Technical Manual for Process Sampling
Strategies for Organic Materials. U.S. Environmental Protection Agency.
Research Triangle Park, N.C. Publication No. EPA 600/2-76-122. April 1976. 172
p.
6. Federal Register,
39 FR 9319-9323. 1974.
7. Federal Register,
39 FR 32857-32860. 1974.
8. Federal Register,
23069-23072 and 23076-23090. 1976.
9. Federal Register,
46569-46571. 1976.
10. Federal Register,
41771-41776. 1977.
11. Fishbein, L.
Chromatography of Environmental Hazards, Volume II. Elesevier Scientific
Publishing Company. New York, N.Y. 1973.
12. Hamersma, J.W.,
S.L. Reynolds, and R.F. Maddalone. EPA/IERL-RTP Procedures Manual: Level 1
Environmental Assessment. U.S. Environmental Protection Agency. Research
Triangle Park, N.C. Publication No. EPA 600/276-160a. June 1976. 130 p.
13. Harris, J.C.,
M.J. Hayes, P.L. Levins, and D.B. Lindsay. EPA/IERL-RTP Procedures for Level 2
Sampling and Analysis of Organic Materials. U.S. Environmental Protection
Agency. Research Triangle Park, N.C. Publication No. EPA 600/7-79-033. February
1979. 154 p.
14. Harris, W.E.,
H.W. Habgood. Programmed Temperature Gas Chromatography. John Wiley and Sons,
Inc. New York. 1966.
15. Intersociety
Committee. Methods of Air Sampling and Analysis. American Health Association.
Washington, D.C. 1972.
16. Jones, P.W., R.D.
Grammer, P.E. Strup, and T.B. Stanford. Environmental Science and Technology.
10:806-810. 1976.
17. McNair Han
Bunelli, E.J. Basic Gas Chromatography. Consolidated Printers. Berkeley. 1969.
18. Nelson, G.O.
Controlled Test Atmospheres, Principles and Techniques. Ann Arbor. Ann Arbor
Science Publishers. 1971. 247 p.
19. NIOSH Manual of
Analytical Methods, Volumes 1, 2, 3, 4, 5, 6, 7. U.S. Department of Health and
Human Services, National Institute for Occupational Safety and Health. Center
for Disease Control. 4676 Columbia Parkway, Cincinnati, Ohio 45226. April 1977
- August 1981. May be available from the Superintendent of Documents,
Government Printing Office, Washington, D.C. 20402. Stock Number/Price:
Volume 1 -
O17-033-00267-3/$13
Volume 2 -
O17-033-00260-6/$11
Volume 3 -
O17-033-00261-4/$14
Volume 4 -
O17-033-00317-3/$7.25
Volume 5 -
O17-033-00349-1/$10,
Volume 6 -
O17-033-00369-6/$9,
Volume 7 -
O17-033-00396-5/$7.
Prices subject to
change. Foreign orders add 25 percent.
20. Schuetzle, D.,
T.J. Prater, and S.R. Ruddell. Sampling and Analysis of Emissions from
Stationary Sources; I. Odor and Total Hydrocarbons. Journal of the Air
Pollution Control Association. 25(9): 925-932. 1975.
21. Snyder, A.D., F.N.
Hodgson, M.A. Kemmer and J.R. McKendree. Utility of Solid Sorbents for Sampling
Organic Emissions from Stationary Sources. U.S. Environmental Protection
Agency. Research Triangle Park, N.C. Publication No. EPA 600/2-76-201. July
1976. 71 p.
22. Tentative Method
for Continuous Analysis of Total Hydrocarbons in the Atmosphere. Intersociety
Committee, American Public Health Association. Washington, D.C. 1972. p.
184-186.
23. Zwerg, G. CRC
Handbook of Chromatography, Volumes I and II. Sherma, Joseph (ed.). CRC Press.
Cleveland. 1972.
18.0 Tables, Diagrams, Flowcharts, and Validation Data.
Figure
18-1. Preliminary survey data sheet.
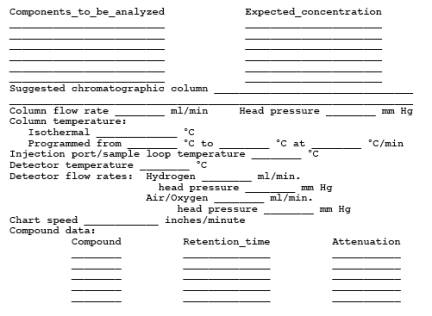
Figure
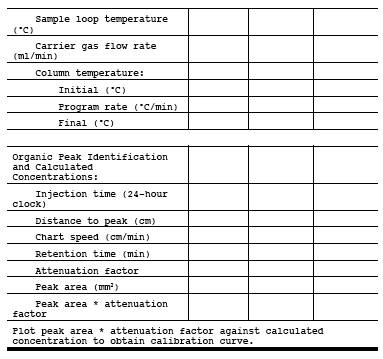
18-2. Chromatographic conditions data sheet.
Figure
18-3. Preparation of Standards in Tedlar Bags and Calibration Curve.
Figure
18-4. Flowmeter Calibration.
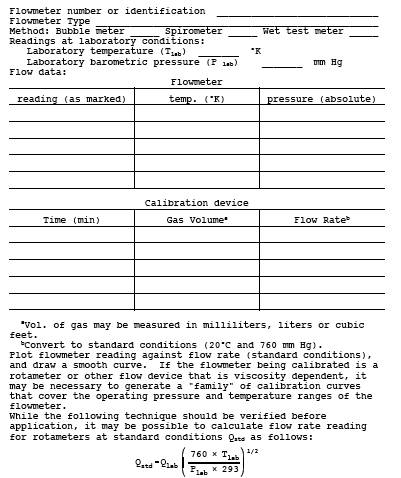
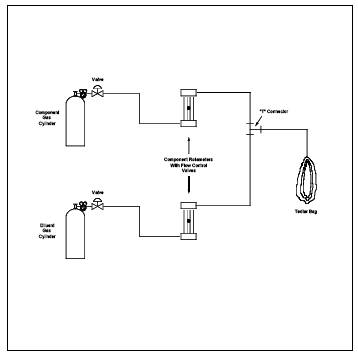
Figure 18-5. Single-Stage Calibration Gas Dilution System.
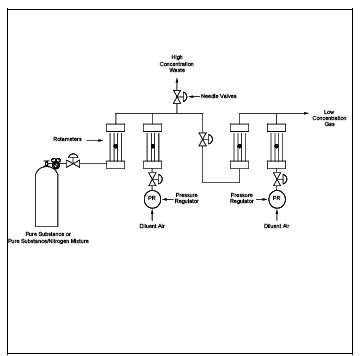
Figure
18-6. Two-Stage Dilution Apparatus.
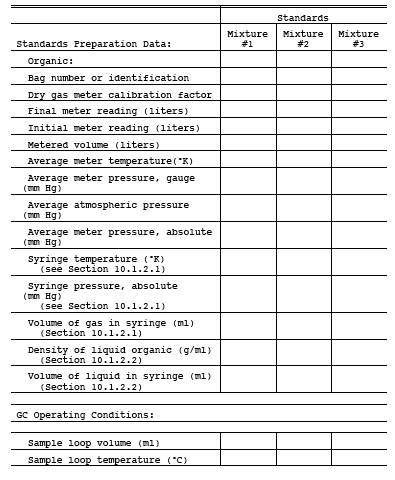
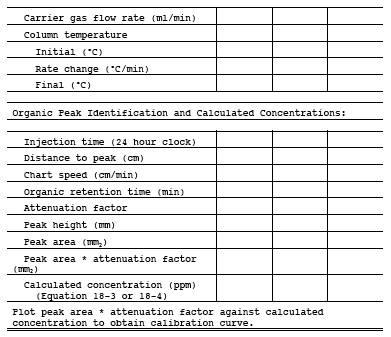
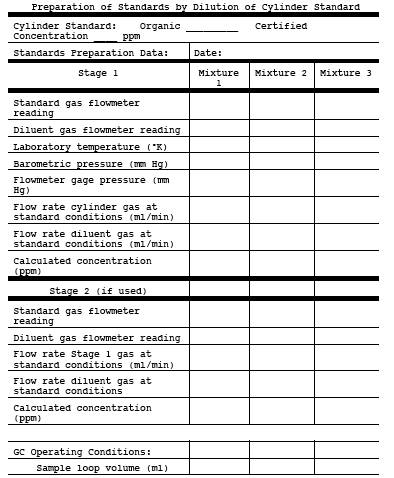
Figure
18-7. Standards prepared by dilution of cylinder standard.
Figure
18-8. Apparatus for Preparation of Liquid Materials.
Figure
18-9. Integrated Bag Sampling Train.
Figure
18-9a. Explosion Risk Gas Sampling Method.
Figure
18-10. Field sample data sheet - Tedlar bag collection method.
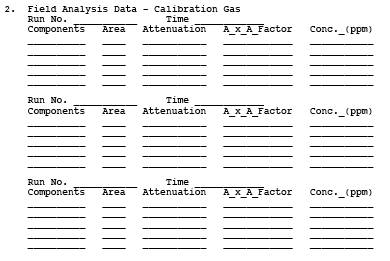
Figure
18-11. Field analysis data sheets.
Figure
18-12. Direct Interface Sampling System.
Figure
18-13. Schematic Diagram of the Heated Box Required for Dilution of Sample Gas.
Figure
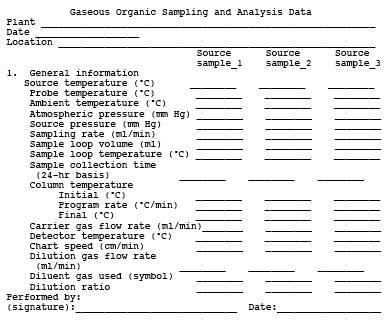
18-14. Sampling and analysis sheet.
component (3 required)