METHOD
1 - SAMPLE AND VELOCITY TRAVERSES FOR STATIONARY SOURCES
NOTE: This method does not include all of the
specifications (e.g.,
equipment and supplies) and procedures (e.g., sampling) essential to its performance. Some
material is incorporated by reference from other methods in this part. Therefore,
to obtain reliable results, persons using this method should have a thorough
knowledge of at least the following additional test method: Method
2.
6.1.2 Differential Pressure
Gauges.
7.0 Reagents and Standards.
[Reserved]
8.0 Sample Collection,
Preservation, Storage, and Transport. [Reserved]
9.0 Quality Control.
[Reserved]
10.0 Calibration and
Standardization. [Reserved]
11.1 Selection of Measurement
Site.
11.2 Determining the Number of
Traverse Points.
11.2.2 Velocity
(Non-Particulate) Traverses.
11.3 Cross-Sectional Layout
and Location of Traverse Points.
11.3.2 Stacks With Diameters
Greater Than 0.61 m (24 in.).
11.3.3 Stacks With Diameters
Equal To or Less Than 0.61 m (24 in.).
11.4 Verification of Absence
of Cyclonic Flow.
11.5 The Alternative Site
Selection
11.5.1 Alternative Measurement
Site Selection Procedure.
12.0 Data Analysis and
Calculations.
12.2 For a rectangular cross
section
12.3 If use of the alternative
site selection procedure (Section 11.5 of this method) is required
13.0 Method Performance.
[Reserved]
14.0 Pollution Prevention.
[Reserved]
15.0 Waste Management.
[Reserved]
17.0 Tables, Diagrams,
Flowcharts, and Validation Data.
1.0 Scope and Application.
1.1 Measured Parameters.
The purpose of the
method is to provide guidance for the selection of sampling ports and traverse
points at which sampling for air pollutants will be performed pursuant to
regulations set forth in this part. Two procedures are presented: a simplified
procedure, and an alternative procedure (see Section 11.5).
The magnitude of cyclonic flow of effluent gas in a stack or duct is the only
parameter quantitatively measured in the simplified procedure.
1.2 Applicability.
This method is applicable
to gas streams flowing in ducts, stacks, and flues. This method cannot be used
when: (1) the flow is cyclonic or swirling; or (2) a stack is smaller than 0.30
meter (12 in.) in diameter, or 0.071 m2 (113 in.2) in cross-sectional area. The simplified procedure cannot be used
when the measurement site is less than two stack or duct diameters downstream
or less than a half diameter upstream from a flow disturbance.
1.3 Data Quality Objectives.
Adherence to the
requirements of this method will enhance the quality of the data obtained from
air pollutant sampling methods.
NOTE: The requirements of this method must be
considered before construction of a new facility from which emissions are to be
measured; failure to do so may require subsequent alterations to the stack or
deviation from the standard procedure. Cases involving variants are subject to
approval by the Administrator.
2.0 Summary of Method.
2.1 This method is
designed to aid in the representative measurement of pollutant emissions and/or
total volumetric flow rate from a stationary source. A measurement site where
the effluent stream is flowing in a known direction is selected, and the
cross-section of the stack is divided into a number of equal areas. Traverse
points are then located within each of these equal areas.
3.0 Definitions. [Reserved]
4.0 Interferences. [Reserved]
5.0 Safety.
5.1 Disclaimer.
This method may
involve hazardous materials, operations, and equipment. This test method may
not address all of the safety problems associated with its use. It is the
responsibility of the user of this test method to establish appropriate safety
and health practices and determine the applicability of regulatory limitations prior
to performing this test method.
6.0 Equipment and Supplies.
6.1 Apparatus.
The apparatus
described below is required only when utilizing the alternative site selection
procedure described in Section 11.5 of this method.
6.1.1 Directional Probe.
Any directional
probe, such as United Sensor Type DA Three-Dimensional Directional Probe,
capable of measuring both the pitch and yaw angles of gas flows is acceptable.
Before using the probe, assign an identification number to the directional
probe, and permanently mark or engrave the number on the body of the probe. The
pressure holes of directional probes are susceptible to plugging when used in
particulate-laden gas streams. Therefore, a procedure for cleaning the pressure
holes by "back-purging" with pressurized air is required.
6.1.2 Differential Pressure Gauges.
Inclined manometers,
U-tube manometers, or other differential pressure gauges (e.g., magnehelic gauges) that meet the
specifications described in Method
2, Section 6.2.
NOTE: If the differential pressure gauge produces both
negative and positive readings, then both negative and positive pressure
readings shall be calibrated at a minimum of three points as specified in
Method 2, Section 6.2.
7.0 Reagents and Standards. [Reserved]
8.0 Sample Collection, Preservation, Storage, and Transport. [Reserved]
9.0 Quality Control. [Reserved]
10.0 Calibration and Standardization. [Reserved]
11.0 Procedure.
11.1 Selection of Measurement Site.
11.1.1
Sampling and/or velocity measurements are performed at a site located at least
eight stack or duct diameters downstream and two diameters upstream from any
flow disturbance such as a bend, expansion, or contraction in the stack, or
from a visible flame. If necessary, an alternative location may be selected, at
a position at least two stack or duct diameters downstream and a half diameter
upstream from any flow disturbance.
11.1.2 An alternative
procedure is available for determining the acceptability of a measurement
location not meeting the criteria above. This procedure described in Section
11.5 allows for the determination of gas flow angles at the sampling points and
comparison of the measured results with acceptability criteria.
11.2 Determining the Number of Traverse Points.
11.2.1 Particulate Traverses.
11.2.1.1 When the
eight- and two-diameter criterion can be met, the minimum number of traverse
points shall be: (1) twelve, for circular or rectangular stacks with diameters
(or equivalent diameters) greater than 0.61 meter (24 in.); (2) eight, for
circular stacks with diameters between 0.30 and 0.61 meter (12 and 24 in.); and
(3) nine, for rectangular stacks with equivalent diameters between 0.30 and
0.61 meter (12 and 24 in.).
11.2.1.2 When the
eight- and two-diameter criterion cannot be met, the minimum number of traverse
points is determined from Figure 1-1. Before referring to
the figure, however, determine the distances from the measurement site to the
nearest upstream and downstream disturbances, and divide each distance by the
stack diameter or equivalent diameter, to determine the distance in terms of
the number of duct diameters. Then, determine from Figure 1-1 the minimum
number of traverse points that corresponds: (1) to the number of duct diameters
upstream; and (2) to the number of diameters downstream. Select the higher of
the two minimum numbers of traverse points, or a greater value, so that for
circular stacks the number is a multiple of 4, and for rectangular stacks, the
number is one of those shown in Table 1-1.
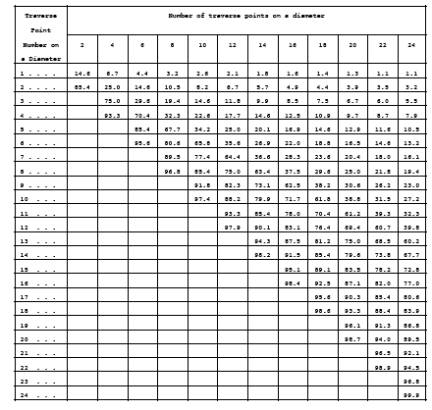
11.2.2 Velocity (Non-Particulate) Traverses.
When velocity or
volumetric flow rate is to be determined (but not particulate matter), the same
procedure as that used for particulate traverses (Section 11.2.1) is followed,
except that Figure 1-2 may be used instead of Figure 1-1.
11.3 Cross-Sectional Layout and Location of
Traverse Points.
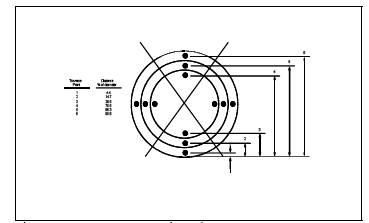
11.3.1 Circular Stacks.
11.3.1.1 Locate the
traverse points on two perpendicular diameters according to Table
1-2 and the example shown in Figure 1-3. Any equation
(see examples in References 2 and 3 in Section 16.0) that
gives the same values as those in Table 1-2 may be used in lieu of Table 1-2.
11.3.1.2 For
particulate traverses, one of the diameters must coincide with the plane
containing the greatest expected concentration variation (e.g., after bends); one diameter shall be congruent
to the direction of the bend. This requirement becomes less critical as the
distance from the disturbance increases; therefore, other diameter locations
may be used, subject to the approval of the Administrator.
11.3.1.3 In addition,
for elliptical stacks having unequal perpendicular diameters, separate traverse
points shall be calculated and located along each diameter. To determine the
cross-sectional area of the elliptical stack, use the following equation:
Square Area = D1
X D2 X
0.7854
Where: D1
= Stack diameter 1
D2 = Stack diameter 2
11.3.1.4 In addition,
for stacks having diameters greater than 0.61 m (24 in.), no traverse points
shall be within 2.5 centimeters (1.00 in.) of the stack walls; and for stack
diameters equal to or less than 0.61 m (24 in.), no traverse points shall be
located within 1.3 cm (0.50 in.) of the stack walls. To meet these criteria,
observe the procedures given below.
11.3.2 Stacks With Diameters Greater Than 0.61 m (24 in.).
11.3.2.1 When any of
the traverse points as located in Section 11.3.1 fall within 2.5 cm (1.0 in.)
of the stack walls, relocate them away from the stack walls to: (1) a distance
of 2.5 cm (1.0 in.); or (2) a distance equal to the nozzle inside diameter,
whichever is larger. These relocated traverse points (on each end of a
diameter) shall be the "adjusted" traverse points.
11.3.2.2 Whenever two
successive traverse points are combined to form a single adjusted traverse
point, treat the adjusted point as two separate traverse points, both in the
sampling and/or velocity measurement procedure, and in recording of the data.
11.3.3 Stacks With Diameters Equal To or Less Than 0.61 m (24 in.).
Follow the procedure
in Section 11.3.1.1, noting only that any "adjusted" points should be
relocated away from the stack walls to: (1) a distance of 1.3 cm (0.50 in.); or
(2) a distance equal to the nozzle inside diameter, whichever is larger.
11.3.4 Rectangular Stacks.
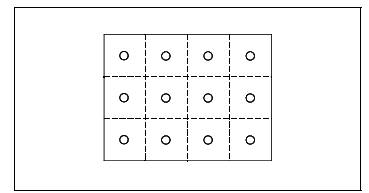
11.3.4.1 Determine
the number of traverse points as explained in Sections 11.1 and 11.2 of this
method. From Table 1-1, determine the grid configuration. Divide the stack cross-section
into as many equal rectangular elemental areas as traverse points, and then
locate a traverse point at the centroid of each equal area according to the
example in Figure 1-4.
11.3.4.2 To use more
than the minimum number of traverse points, expand the "minimum number of
traverse points" matrix (see Table 1-1) by adding the extra traverse
points along one or the other or both legs of the matrix; the final matrix need
not be balanced. For example, if a 4 x 3 "minimum number of points"
matrix were expanded to 36 points, the final matrix could be 9 x 4 or 12 x 3,
and would not necessarily have to be 6 x 6. After constructing the final
matrix, divide the stack cross-section into as many equal rectangular, elemental
areas as traverse points, and locate a traverse point at the centroid of each
equal area.
11.3.4.3 The
situation of traverse points being too close to the stack walls is not expected
to arise with rectangular stacks. If this problem should ever arise, the Administrator
must be contacted for resolution of the matter.
11.4 Verification of Absence of Cyclonic Flow.
11.4.1 In most
stationary sources, the direction of stack gas flow is essentially parallel to
the stack walls. However, cyclonic flow may exist (1) after such devices as
cyclones and inertial demisters following venturi scrubbers, or (2) in stacks
having tangential inlets or other duct configurations which tend to induce
swirling; in these instances, the presence or absence of cyclonic flow at the sampling
location must be determined. The following techniques are acceptable for this
determination.
11.4.2 Level and zero
the manometer. Connect a Type S pitot tube to the manometer and leak-check
system. Position the Type S pitot tube at each traverse point, in succession,
so that the planes of the face openings of the pitot tube are perpendicular to
the stack cross-sectional plane; when the Type S pitot tube is in this
position, it is at "0° reference." Note the differential pressure
(•p) reading at each traverse point. If a null (zero) pitot reading is obtained
at 0° reference at a given traverse point, an acceptable flow condition exists
at that point. If the pitot reading is not zero at 0° reference, rotate the
pitot tube (up to ±90° yaw angle), until a null reading is obtained. Carefully
determine and record the value of the rotation angle (•) to the nearest degree.
After the null technique has been applied at each traverse point, calculate the
average of the absolute values of •; assign • values of 0° to those points for
which no rotation was required, and include these in the overall average. If
the average value of • is greater than 20°, the overall flow condition in the
stack is unacceptable, and alternative methodology, subject to the approval of the
Administrator, must be used to perform accurate sample and velocity traverses.
11.5 The Alternative Site Selection
The alternative site
selection procedure may be used to determine the rotation angles in lieu of the
procedure outlined in Section 11.4.
11.5.1 Alternative Measurement Site Selection Procedure.
This alternative
applies to sources where measurement locations are less than 2 equivalent or
duct diameters downstream or less than one-half duct diameter upstream from a
flow disturbance. The alternative should be limited to ducts larger than 24 in.
in diameter where blockage and wall effects are minimal. A directional
flowsensing probe is used to measure pitch and yaw angles of the gas flow at 40
or more traverse points; the resultant angle is calculated and compared with
acceptable criteria for mean and standard deviation.
NOTE: Both the pitch and yaw angles are measured from
a line passing through the traverse point and parallel to the stack axis. The
pitch angle is the angle of the gas flow component in the plane that INCLUDES
the traverse line and is parallel to the stack axis. The yaw angle is the angle
of the gas flow component in the plane PERPENDICULAR to the traverse line at
the traverse point and is measured from the line passing through the traverse
point and parallel to the stack axis.
11.5.2 Traverse Points.
Use a minimum of 40
traverse points for circular ducts and 42 points for rectangular ducts for the
gas flow angle determinations. Follow the procedure outlined in Section 11.3
and Table 1-1 or 1-2 for the location and layout of the traverse points. If the
measurement location is determined to be acceptable according to the criteria
in this alternative procedure, use the same traverse point number and locations
for sampling and velocity measurements.
11.5.3 Measurement Procedure.
11.5.3.1 Prepare the
directional probe and differential pressure gauges as recommended by the
manufacturer. Capillary tubing or surge tanks may be used to dampen pressure
fluctuations. It is recommended, but not required, that a pretest leak check be
conducted. To perform a leak check, pressurize or use suction on the impact
opening until a reading of at least 7.6 cm (3 in.) H20 registers on the differential pressure gauge, then plug the
impact opening. The pressure of a leak-free system will remain stable for at
least 15 seconds.
11.5.3.2 Level and
zero the manometers. Since the manometer level and zero may drift because of
vibrations and temperature changes, periodically check the level and zero
during the traverse.
11.5.3.3 Position the
probe at the appropriate locations in the gas stream, and rotate until zero
deflection is indicated for the yaw angle pressure gauge. Determine and record
the yaw angle. Record the pressure gauge readings for the pitch angle, and
determine the pitch angle from the calibration curve. Repeat this procedure for
each traverse point. Complete a "back-purge" of the pressure lines
and the impact openings prior to measurements of each traverse point.
11.5.3.4 A post-test
check as described in Section 11.5.3.1 is required. If the criteria for a
leak-free system are not met, repair the equipment, and repeat the flow angle
measurements.
11.5.4 Calibration.
Use a flow system as
described in Sections 10.1.2.1 and 10.1.2.2 of Method 2. In addition, the flow
system shall have the capacity to generate two test-section velocities: one
between 365 and 730 m/min (1,200 and 2,400 ft/min) and one between 730 and
1,100 m/min (2,400 and 3,600 ft/min).
11.5.4.1 Cut two
entry ports in the test section. The axes through the entry ports shall be
perpendicular to each other and intersect in the centroid of the test section.
The ports should be elongated slots parallel to the axis of the test section
and of sufficient length to allow measurement of pitch angles while maintaining
the pitot head position at the test-section centroid. To facilitate alignment
of the directional probe during calibration, the test section should be
constructed of plexiglass or some other transparent material. All calibration
measurements should be made at the same point in the test section, preferably
at the centroid of the test section.
11.5.4.2 To ensure
that the gas flow is parallel to the central axis of the test section, follow
the procedure outlined in Section 11.4 for cyclonic flow determination to
measure the gas flow angles at the centroid of the test section from two test
ports located 90° apart. The gas flow angle measured in each port must be ± 2°
of 0°. Straightening vanes should be installed, if necessary, to meet this
criterion.
11.5.4.3 Pitch Angle
Calibration. Perform a calibration traverse according to the manufacturer's
recommended protocol in 5° increments for angles from -60° to +60° at one
velocity in each of the two ranges specified above. Average the pressure ratio
values obtained for each angle in the two flow ranges, and plot a calibration
curve with the average values of the pressure ratio (or other suitable
measurement factor as recommended by the manufacturer) versus the pitch angle.
Draw a smooth line through the data points. Plot also the data values for each
traverse point. Determine the differences between the measured data values and
the angle from the calibration curve at the same pressure ratio. The difference
at each comparison must be within 2° for angles between 0° and 40° and within
3° for angles between 40° and 60°.
11.5.4.4 Yaw Angle
Calibration. Mark the three-dimensional probe to allow the determination of the
yaw position of the probe. This is usually a line extending the length of the
probe and aligned with the impact opening. To determine the accuracy of
measurements of the yaw angle, only the zero or null position need be
calibrated as follows: Place the directional probe in the test section, and
rotate the probe until the zero position is found. With a protractor or other
angle-measuring device, measure the angle indicated by the yaw angle indicator
on the three-dimensional probe. This should be within 2° of 0°. Repeat this
measurement for any other points along the length of the pitot where yaw angle measurements
could be read in order to account for variations in the pitot markings used to
indicate pitot head positions.
12.0 Data Analysis and Calculations.
12.1 Nomenclature.
L = length
n = total number of
traverse points.
Pi = pitch angle at traverse point i, degree.
Ravg = average resultant angle, degree.
Ri = resultant angle at traverse point i, degree.
Sd = standard deviation, degree.
W = width.
Yi = yaw angle at traverse point i, degree.
12.2 For a rectangular cross section
An equivalent diameter
(De) shall be calculated using the following
equation, to determine the upstream and downstream distances:
![]()
12.3 If use of the alternative site selection procedure (Section 11.5 of this method) is required
Perform the following
calculations using the equations below: the resultant angle at each traverse
point, the average resultant angle, and the standard deviation. Complete the
calculations retaining at least one extra significant figure beyond that of the
acquired data. Round the values after the final calculations.
12.3.1 Calculate the
resultant angle at each traverse point:
![]()
12.3.2 Calculate the
average resultant for the measurements:
![]()
12.3.3 Calculate the
standard deviations:
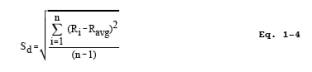
12.3.4 Acceptability
Criteria. The measurement location is acceptable if Ravg ≤ 20° and Sd ≤ 10°.
13.0 Method Performance. [Reserved]
14.0 Pollution Prevention. [Reserved]
15.0 Waste Management. [Reserved]
16.0 References.
1. Determining Dust Concentration
in a Gas Stream, ASME Performance Test Code No. 27. New York. 1957.
2. DeVorkin, Howard,
et al. Air Pollution Source Testing Manual. Air Pollution Control District. Los
Angeles, CA. November 1963.
3. Methods for
Determining of Velocity, Volume, Dust and Mist Content of Gases. Western
Precipitation Division of Joy Manufacturing Co. Los Angeles, CA. Bulletin
WP-50. 1968.
4. Standard Method
for Sampling Stacks for Particulate Matter. In: 1971 Book of ASTM Standards,
Part 23. ASTM Designation D 2928-71. Philadelphia, PA. 1971.
5. Hanson, H.A., et
al. Particulate Sampling Strategies for Large Power Plants Including Nonuniform
Flow. USEPA, ORD, ESRL, Research Triangle Park, NC. EPA-600/2-76-170. June
1976.
6. Entropy
Environmentalists, Inc. Determination of the Optimum Number of Sampling Points:
An Analysis of Method 1 Criteria. Environmental Protection Agency. Research
Triangle Park, NC. EPA Contract No. 68-01-3172, Task 7.
7. Hanson, H.A., R.J.
Davini, J.K. Morgan, and A.A. Iversen. Particulate Sampling Strategies for
Large Power Plants Including Nonuniform Flow. USEPA, Research Triangle Park,
NC. Publication No. EPA-600/2-76-170. June 1976. 350 pp.
8. Brooks, E.F., and
R.L. Williams. Flow and Gas Sampling Manual. U.S. Environmental Protection
Agency. Research Triangle Park, NC. Publication No. EPA-600/2-76- 203. July
1976. 93 pp.
9. Entropy
Environmentalists, Inc. Traverse Point Study. EPA Contract No. 68-02-3172. June
1977. 19 pp.
10. Brown, J. and K.
Yu. Test Report: Particulate Sampling Strategy in Circular Ducts. Emission
Measurement Branch. U.S. Environmental Protection Agency, Research Triangle
Park, NC 27711. July 31, 1980. 12 pp.
11. Hawksley, P.G.W.,
S. Badzioch, and J.H. Blackett. Measurement of Solids in Flue Gases.
Leatherhead, England, The British Coal Utilisation Research Association. 1961.
pp. 129-133.
12. Knapp, K.T. The
Number of Sampling Points Needed for Representative Source Sampling. In:
Proceedings of the Fourth National Conference on Energy and Environment.
Theodore, L. et al. (ed). Dayton, Dayton Section of the American Institute of
Chemical Engineers. October 3-7, 1976. pp. 563-568.
13. Smith, W.S. and
D.J. Grove. A Proposed Extension of EPA Method 1 Criteria. Pollution
Engineering. XV (8):36-37. August 1983.
14. Gerhart, P.M. and
M.J. Dorsey. Investigation of Field Test Procedures for Large Fans. University
of Akron. Akron, OH. (EPRI Contract CS-1651). Final Report (RP-1649- 5).
December 1980.
15. Smith, W.S. and
D.J. Grove. A New Look at Isokinetic Sampling - Theory and Applications. Source
Evaluation Society Newsletter. VIII(3):19-24. August 1983.
17.0 Tables, Diagrams, Flowcharts, and Validation Data.
Figure
1-1. Minimum number of traverse points for particulate traverses.
TABLE 1-1. CROSS-SECTION LAYOUT FOR
RECTANGULAR
STACKS
_____________________________________________
Number
of tranverse points Matrix
layout
_____________________________________________
9 . . . . . . . . . . . . . . . . 3 x 3
12
. . . . . . . . . . . . . . . . 4 x 3
16
. . . . . . . . . . . . . . . . 4 x 4
20
. . . . . . . . . . . . . . . . 5 x 4
25
. . . . . . . . . . . . . . . . 5 x 5
30
. . . . . . . . . . . . . . . . 6 x 5
36
. . . . . . . . . . . . . . . . 6 x 6
42
. . . . . . . . . . . . . . . . 7 x 6
49
. . . . . . . . . . . . . . . . 7 x 7
_____________________________________________
Figure
1-2. Minimum number of traverse points for velocity (nonparticulate) traverses.
LOCATION
OF TRAVERSE POINTS IN CIRCULAR STACKS
(Percent
of stack diameter from inside wall to traverse point)
Figure
1-3. Example showing circular stack cross section divided into 12 equal areas,
with location of traverse points.
Figure
1-4. Example showing rectangular stack cross section divided into 12 equal
areas, with traverse points at centroid of each area.