Method 20 -
Determination of Nitrogen Oxides, Sulfur Dioxide, and Oxygen Emissions from
Stationary Gas Turbines
1. APPLICABILITY
AND PRINCIPLE
3. MEASUREMENT SYSTEM
PERFORMANCE SPECIFICATIONS
4.4 Diluent Calibration
Gases.
5. MEASUREMENT SYSTEM
PERFORMANCE TEST PROCEDURES
5.2 Measurement System
Preparation.
5.6 NO2 to NO
Conversion Efficiency.
6. EMISSION MEASUREMENT
TEST PROCEDURE
6.1.1 Selection of a
Sampling Site.
6.1.2.1 Minimum Number
of Points.
6.1.2.2 Cross-sectional
Layout and Location of Traverse Points.
6.1.2.3 Preliminary
Diluent Measurement.
6.1.2.4 Selection of
Emission Test Sampling Points.
6.2 NOx and Diluent
Measurement.
7.3 Correction of
Pollutant Concentrations to 15 percent O2.
7.4 Average Adjusted
NOx Concentration.
7.5 NOx and SO2
Emission Rate Calculations.
1. APPLICABILITY AND PRINCIPLE
1.1 Applicability.
This method is
applicable for the determination of nitrogen oxides (NOx), sulfur dioxide
(SO2), and oxygen (O2) emissions from stationary gas turbines. For the NOx and
O2 determinations, this method includes: (1) measurement system design
criteria, (2) analyzer performance specifications and performance test
procedures; and (3) procedures for emission testing.
1.2 Principle.
A gas sample
in continuously extracted from the exhaust stream of a stationary gas turbine;
a portion of the sample stream is conveyed to instrumental analyzers for
determination of NOx and O2 content. During each NOx and O2 determination, a
separate measurement of SO2 emissions is made, using Method
6, or its equivalent. The O2 determination is used to adjust the NOx and
SO2 concentrations to a reference condition.
2. DEFINITIONS
2.1 Measurement System.
The total
equipment required for the determination of a gas concentration or a gas
emission rate. The system consists of the following major subsystems:
2.1.1 Sample Interface.
That portion
of a system that is used for one or more of the following: sample acquisition,
sample transportation, sample conditioning, or protection of the analyzers from
the effects of the stack effluent.
2.1.2 NOx Analyzer.
That portion
of the system that senses NOx and
generates an output proportional to the gas concentration.
2.1.3 O2 Analyzer.
That portion
of the system that senses O2 and
generates an output proportional to the gas concentration.
2.2 Span Value.
The upper
limit of a gas concentration measurement range that is specified for affected source
categories in the applicable part of the regulations.
2.3 Calibration Gas.
A known
concentration of a gas in an appropriate diluent gas.
2.4 Calibration Error.
The difference
between the gas concentration indicated by the measurement system and the known
concentration of the calibration gas.
2.5 Zero Drift.
The difference
in the measurement system output readings from zero after a stated period of
operation during which no unscheduled maintenance, repair, or adjustment took
place and the input concentration at the time of the measurements was zero.
2.6 Calibration Drift.
The difference
in the measurement system output readings from the known concentration of the
calibration gas after a stated period of operation during which no unscheduled
maintenance, repair, or adjustment took place and the input at the time of the
measurements was a high-level value.
2.7 Response Time.
The amount of
time required for the continuous monitoring system to display on the data
output 95 percent of a step change in pollutant concentration.
2.8 Interference Response.
The output
response of the measurement system to
a component in
the sample gas other than the gas component being measured.
3. MEASUREMENT SYSTEM PERFORMANCE SPECIFICATIONS
3.1 NO2 to NO Converter. Greater than 90 percent conversion
efficiency of
NO2 to NO.
3.2
Interference Response. Less
than ±2 percent of span value.
3.3
Response Time. No
greater than 3 seconds.
3.4 Zero
Drift. Less than ±2
percent of span value over the period of each test run.
3.5
Calibration Drift. Less
than ±2 percent of span value over the period of each test run.
4. APPARATUS AND REAGENT
4.1 Measurement System.
Use any
measurement system for NOx and O2 that is expected to meet the specifications
in this method. A schematic of an acceptable measurement system is shown in Figure 20-1. The essential components of the measurement
system are described below:
4.1.1
Sample Probe. Heated
stainless steel, or equivalent, open-ended, straight tube of sufficient length
to traverse the sample points.
4.1.2
Sample Line. Heated
(>95˚C) stainless steel or Teflon tubing to transport the sample gas to the
sample conditioners and analyzers.
4.1.3
Calibration Valve Assembly. A
three-way valve assembly to direct the zero and calibration gases to the sample
conditioners and to the analyzers. The calibration valve assembly shall be
capable of blocking the sample gas flow and of introducing calibration gases to
the measurement system when in the calibration mode.
4.1.4 NO2 to NO Converter. That portion of the system that converts
NO2 in the sample gas to NO. Some analyzers
are designed to measure NOx as NO2 on a wet basis and can be used without an
NO2 to NO converter or a moisture removal trap provided the sample line to the
analyzer is heated (>95˚C) to the inlet of the analyzer. In addition, an NO2
to NO converter is not necessary if the NO2 portion of the exhaust gas is less
than 5 percent of the total NOx concentration. As a guideline, an NO2 to NO
converter is not necessary if the gas turbine is operated at 90 percent or more
of peak load capacity. A converter is necessary under lower load conditions.
4.1.5
Moisture Removal Trap. A
refrigerator-type condenser or other type device designed to remove continuously
condensate from the sample gas while maintaining minimal contact between any
condensate and the sample gas. The moisture removal trap is not necessary for
analyzers that can measure NOx concentrations
on a wet basis; for these analyzers, (a) heat the sample line up to the inlet
of the analyzers, (b) determine the moisture content using methods subject to
the approval of the Administrator, and (c) correct the NOx and O2 concentration to a dry basis.
4.1.6
Particulate Filter. An
in-stack or an out-of-stack glass fiber filter, of the type specified in Method
5; however, an out-of-stack filter is recommended when the stack gas
temperature exceeds 250 to 300˚C.
4.1.7
Sample Pump. A
nonreactive leak-free sample pump to pull the sample gas through the system at
a flow rate sufficient to minimize transport delay. The pump shall be made from
stainless steel or coated with Teflon, or equivalent.
4.1.8
Sample Gas Manifold. A
sample gas manifold to divert portions of the sample gas stream to the
analyzers. The manifold may be constructed of glass, Teflon, stainless steel,
or equivalent.
4.1.9
Diluent Gas. An analyzer
to determine the percent O2 or CO2 concentration of the sample gas stream.
4.1.10
Nitrogen Oxides Analyzer. An
analyzer to determine the ppm NOx concentration
in the sample gas stream.
4.1.11 Data
Output. A strip-chart
recorder, analog computer, or digital recorder for recording measurement data.
4.2 SO2 Analysis.
Method 6
apparatus and reagents.
4.3 NOx Calibration Gases.
The
calibration gases for the NOx analyzer shall be NO in N2. Use four
calibration gas mixtures as specified below:
4.3.1
High-level Gas. A gas
concentration that is equivalent to 80 to 90 percent of the span value.
4.3.2
Mid-level Gas. A gas
concentration that is equivalent to 45 to 55 percent of the span value.
4.3.3
Low-level Gas. A gas
concentration that is equivalent to 20 to 30 percent of the span value.
4.3.4 Zero
Gas. A gas concentration
of less than 0.25 percent of the span value. Ambient air may be used for the
NOx zero gas.
4.4 Diluent Calibration Gases.
Use purified
air at 20.9 percent O2 as the high-level O gas. Use a gas concentration that is
equivalent to 11-14 percent O2 in N2 for the mid-level gas. Use purified N2 for
the zero gas.
5. MEASUREMENT SYSTEM PERFORMANCE TEST PROCEDURES
Perform the
following procedures before measurement of emissions (Section 6) and only once
for each test program, i.e., the series of all test runs for a given gas
turbine engine.
5.1 Calibration Gas Checks.
There are two
alternatives for checking gases. (a) The first is to use calibration gases that
are documented traceable to National Bureau of Standards Reference Materials.
Use "Traceability Protocol for Establishing True Concentrations of Gases
Used for Calibrations and Audits of Continuous Source Emission Monitors"
(Protocol Number 1) that is available from the Environmental Monitoring Support
Laboratory, Quality Assurance Branch, Mail Drop 77, Environmental Protection
Agency, Research Triangle Park, NC 27711. Obtain a certification from the gas
manufacturer that the protocol was followed. These calibration gases are not to
be analyzed with the Reference Methods. (b) The second alternative is to use
calibration gases not prepared according to the protocol. If this alternative
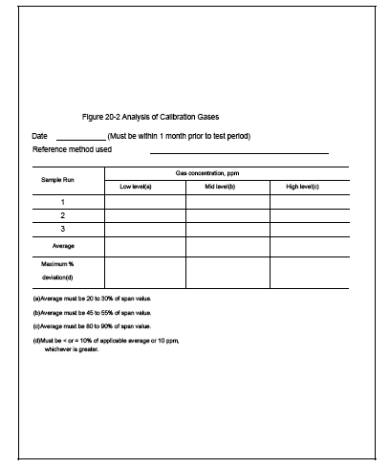
is chosen, within 1 month prior to the emission test, analyze each of the
calibration gas mixtures in triplicate using Method 7
or the procedure outlined in Citation 1 of the Bibliography for NOx and use Method 3 for O2 or CO2 . Record the results on a data
sheet (example is shown in Figure 20-2). For the
low-level, mid-level, or high-level gas mixtures, each of the individual NOx
analytical results must be within 10 percent (or 10 ppm, whichever is greater)
of the triplicate set average (O2 or CO2 test results must be within 0.5
percent O2 or CO2);otherwise, discard the entire set and repeat the triplicate
analyses. If the average of the triplicate reference method test results is
within 5 percent for NOx gas or 0.5 percent O2 or CO2 for the O2 or CO2 gas of
the calibration gas manufacturer's tag value, use the tag value; otherwise,
conduct at least three additional reference method test analyses until the
results of six individual NOx runs (the three original plus three additional)
agree within 10 percent (or 10 ppm, whichever is greater) of the average (O2 or
CO2 test results must be within 0.5 percent O2 or CO2 ). Then use this average
for the cylinder value.
5.2 Measurement System Preparation.
Before the
emission test, assemble the measurement system following the manufacturer's
written instructions in preparing and operating the NO2 to NO converter, the
NOx analyzer, the O2 analyzer, and other components.
5.3 Calibration Check.
Conduct the
calibration checks for both the NO2 and the diluent analyzers as follows:
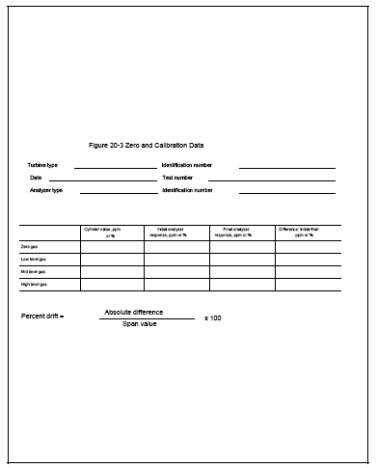
5.3.1 After the measurement system has been
prepared for use (Section 5.2), introduce zero gases and the mid-level
calibration gases; set the analyzer output responses to the appropriate levels.
Then introduce each of the remainder of the calibration gases described in
Section 4.3 or 4.4, one at a time, to the measurement system. Record the
responses on a form similar to Figure 20-3.
5.3.2 If the linear curve determined from the
zero and mid-level calibration gas responses does not predict the actual
response of the low-level (not applicable for the diluent analyzer) and high-level
gases within ±2 percent of the span value, the calibration shall be considered
invalid. Take corrective measures on the measurement system before proceeding
with the test.
5.4 Interference Response.
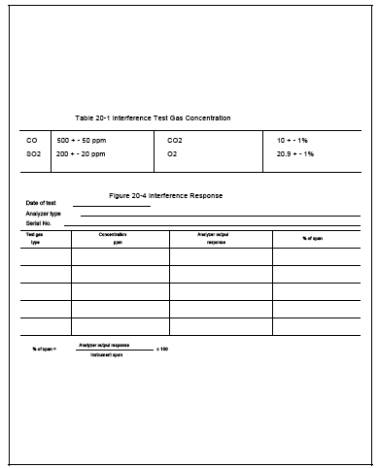
5.4.1 Introduce the gaseous components listed
in Table 20-1 into the measurement system separately, or
as gas mixtures. Determine the total interference output response of the system
to these components in concentration units; record the values on a form similar
to Figure 20-4. If the sum of the interference responses
of the test gases for either the NOx or diluent analyzers is greater than 2
percent of the applicable span value, take corrective measures on the
measurement system.
5.4.2 Conduct an interference response test of
each analyzer before its initial use in the field. Thereafter, recheck the
measurement system if changes are made in the instrumentation that could alter
the interference response, e.g., changes in the type of gas detector.
5.4.3 In lieu of conducting the interference
response test, instrument vendor data, which demonstrate that for the test
gases of Table 20-1 the interference performance specification is not exceeded,
are acceptable.
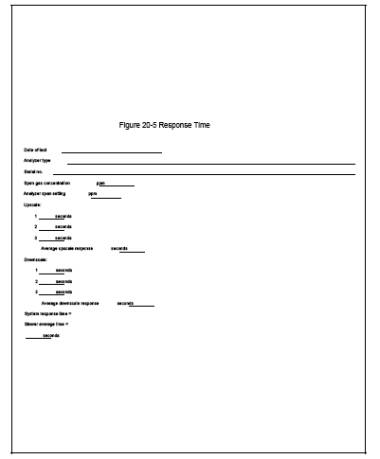
5.5 Response Time.
To determine
response time, first introduce zero gas into the system at the calibration
valve until all readings are stable; then, switch to monitor the stack effluent
until a stable reading can be obtained. Record the upscale response time. Next,
introduce high-level calibration gas into the system. Once the system has
stabilized at the high-level calibration concentration, switch to monitor the
stack effluent and wait until a stable value is reached. Record the downscale
response time. Repeat the procedure three times. A stable value is equivalent
to a change of less than 1 percent of span value for 30 seconds or less than 5
percent of the measured average concentration for 2 minutes. Record the
response time data on a form similar to Figure 20-5, the
readings of the upscale or downscale response time, and report the greater time
as the "response time" for the analyzer. Conduct a response time test
before the initial field use of the measurement system, and repeat if changes
are made in the measurement system.
5.6 NO2
to NO Conversion Efficiency.
5.6.1 Add gas from the mid-level NO in N2
calibration gas cylinder to a clean, evacuated, leak-tight Tedlar bag. Dilute
this gas approximately 1:1 with 20.9 percent O2, purified air. Immediately
attach the bag outlet to the calibration valve assembly and begin operation of
the sampling system. Operate the sampling system, recording the NOx response,
for at least 30 minutes. If the NO2 to NO conversion is 100 percent, the
instrument response will be stable at the highest peak value observed. If the
response at the end of 30 minutes decreases more than 2.0 percent of the
highest peak value, the system is not acceptable and corrections must be made
before repeating the check.
5.6.2 Alternatively, the NO2 to NO converter
check described in title 40, Part 86: Certification and Test Procedures for
Heavy-duty Engines for 1979 and Later Model Years, may be used. Other
alternative procedures may be used with approval of the Administrator.
6. EMISSION MEASUREMENT TEST PROCEDURE
6.1 Preliminaries.
6.1.1 Selection of a Sampling Site.
Select a
sampling site as close as practical to the exhaust of the turbine. Turbine
geometry, stack configuration, internal baffling, and point of introduction of
dilution air will vary for different turbine designs. Thus, each of these
factors must be given special consideration in order to obtain a representative
sample. Whenever possible, the sampling site shall be located upstream of the
point of introduction of dilution air into the duct. Sample ports may be
located before or after the upturn elbow, in order to accommodate the
configuration of the turning vanes and baffles and to permit a complete,
unobstructed traverse of the stack. The sample ports shall not be located
within 5 feet or 2 diameters (whichever is less) of the gas discharge to
atmosphere. For supplementary-fired, combined-cycle plants, the sampling site
shall be located between the gas turbine and the boiler. The diameter of the
sample ports shall be sufficient to allow entry of the sample probe.
6.1.2 Preliminary O2 or CO2
A preliminary
O2 or CO2 traverse is made for the purpose of selecting sampling points of low
O2 values or high CO2 concentrations as appropriate for the measurement system.
Conduct this test at the turbine operating condition that is the lowest
percentage of peak load operation included in the program. Follow the procedure
below or alternative procedures subject to the approval of the Administrator.
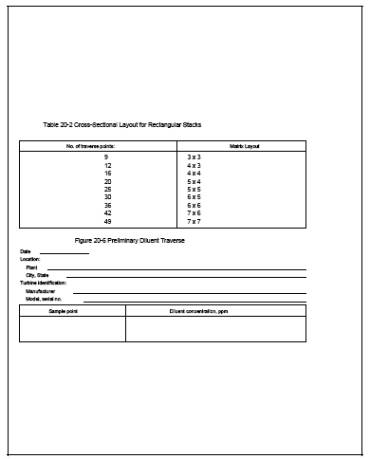
6.1.2.1 Minimum Number of Points.
Select a minimum
number of points as follows: (1) Eight, for stacks having cross-sectional areas
less than 1.5 m2
(16.1 ft2); (2) eight plus one additional sample
point for each 0.2 m2
(2.2 ft2) of areas, for stacks of 1.5 m2 to 10.0 m2 (16.1
to 107.6 ft2) in cross-sectional area; and (3) 49
sample points (48 for circular stacks) for stacks greater than 10.0 m2 (107.6 ft2)
in cross-sectional area. Note that for circular ducts, the number of sample
points must be a multiple of 4, and for rectangular ducts, the number of points
must be one of those listed in Table 20-2; therefore,
round off the number of points (upward), when appropriate.
6.1.2.2 Cross-sectional Layout and Location of Traverse Points.
After the
number of traverse points for the preliminary diluent sampling has been
determined, use Method 1 to locate the traverse points.
6.1.2.3 Preliminary Diluent Measurement.
While the gas
turbine is operating at the lowest percent of peak load, conduct a preliminary
diluent measurement as follows: Position the probe at the first traverse point
and begin sampling. The minimum sampling time at each point shall be 1 minute
plus the average system response time. Determine the average steady-state
concentration of O2 at each point and record the data on Figure
20-6.
6.1.2.4 Selection of Emission Test Sampling Points.
Select the
eight sampling points at which the lowest O2 concentrations or highest CO2
concentrations were obtained. Sample at each of these selected points during
each run at the different load conditions. More than eight points may be used,
if desired, providing that the points selected as described above are included.
6.2 NOx and Diluent Measurement.
This test is
to be conducted at each of the specified load conditions. Three test runs at
each load condition constitute a complete test.
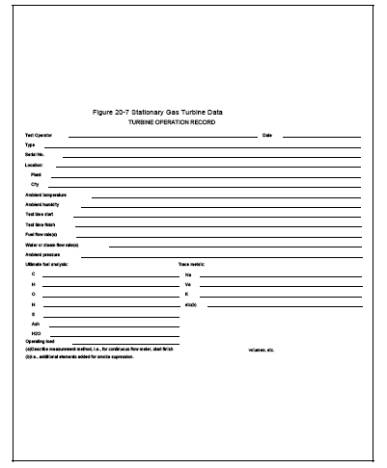
6.2.1 At the beginning of each NOx test run
and, as applicable, during the run, record turbine data as indicated in Figure 20-7. Also, record the location and number of the
traverse points on a diagram.
6.2.2 Position the probe at the first point
determined in the preceding section and begin sampling. The minimum sampling
time at each point shall be at least 1 minute plus the average system response
time. Determine the average steady-state concentration of diluent and NOx at
each point and record the data on Figure 20-8.
6.2.3 After sampling the last point, conclude
the test run by recording the final turbine operating parameters and by
determining the zero and calibration drift, as follows: Immediately following
the test run at each load condition, or if adjustments are necessary for the
measurement system during the tests, reintroduce the zero and mid-level
calibration gases as described in Sections 4.3 and 4.4, one at a time, to the
measurement system at the calibration valve assembly. (Make no adjustments to
the measurement system until after the drift checks are made). Record the
analyzers' responses on a form similar to Figure 20-3. If the drift values
exceed the specified limits, the test run preceding the check is considered
invalid and will be repeated following corrections to the measurement system.
Alternatively, recalibrate the measurement system and recalculate the
measurement data. Report the test results based on both the initial calibration
and the recalibration data.
6.3 SO2 Measurement.
6.3.1 This test is conducted only at the 100 percent
peak load condition. Determine SO2 using Method 6, or equivalent, during the
test. Select a minimum of six total points from those required for the NOx
measurements; use two points for each sample run. The sample time at each point
shall be at least 10 minutes. Average the O2 readings taken during the NOx test
runs at sample points corresponding to the SO2 traverse points (see Section
6.2.2) and use this average diluent concentration to correct the integrated SO2 concentration obtained by Method 6 to 15 percent O2 (see Equation 20-1).
6.3.2 If the applicable regulation allows fuel
sampling and analysis for fuel sulfur content to demonstrate compliance with
sulfur emission unit, emission sampling with Method 6 is not required, provided
the fuel sulfur content meets the limits of the regulation.
7. EMISSION CALCULATIONS
7.1 Moisture Correction.
Measurement
data used in most of these calculations must be on a dry basis. If measurements
must be corrected to dry conditions, use the following equation:
![]()
where:
C d = Pollutant or diluent concentration
adjusted to dry conditions, ppm or percent
C w = Pollutant or diluent concentration
measured under moist sample conditions, ppm or percent.
B ws = Moisture content of sample gas as
measured with Method 4, reference method, or other approved method,
percent/100.
7.2 CO2 Correction Factor.
If pollutant
concentrations are to be corrected to 15 percent O2 and CO2 concentration is
measured in lieu of O2 concentration measurement, a CO2 correction factor is
needed. Calculate the CO2 correction factor as follows:
7.2.1 Calculate the fuel-specific F0 value for the fuel burned during the
test using values obtained from Method 19, Section 5.2, and the following
equation.
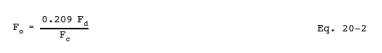
Where:
F o = Fuel factor based on the ratio of
oxygen volume to the ultimate CO2 volume produced by the fuel at zero percent
excess air, dimensionless.
0.209 =
Fraction of air that is oxygen, percent/100.
F d = Ratio of the volume of dry effluent
gas to the gross calorific value of the fuel from Method 19, dsm3/J (dscf/106Btu).
F c = Ratio of the volume or carbon dioxide
produced to the gross calorific value of the fuel from Method 19, dsm3/J (dscf/106 Btu).
7.2.2 Calculate the CO2 correction factor for
correcting measurement data to 15 percent oxygen, as follows:
![]()
where:
X CO2 = CO2
Correction factor, percent.
5.9 = 20.9
percent O2 - 15 percent O2 , the defined O2 correction value, percent.
7.3 Correction of Pollutant Concentrations to 15 percent O2.
Calculate the
NOx and SO2 gas concentrations adjusted to 15 percent O2 using Equation 20-4 or
20-5, as appropriate. The correction to 15 percent O2 is very sensitive to the
accuracy of the O2 or CO2 concentration measurement. At the level of the
analyzer drift specified in Section 3, the O2 or CO2 correction can exceed 5
percent at the concentration levels expected in gas turbine exhaust gases.
Therefore, O2 or CO2 analyzer stability and careful calibration are necessary.
7.3.1 Correction of Pollutant Concentration
Using O2 Concentration. Calculate the O2 corrected pollutant concentration, as
follows:
![]()
where:
C adj = Pollutant concentration corrected to
15 percent O2 ppm.
C d = Pollutant concentration measured, dry
basis, ppm.
%O2 = Measured O2 concentration dry basis,
percent.
7.3.2 Correction of Pollutant Concentration
Using CO2 Concentration. Calculate the CO2 corrected pollutant concentration,
as follows:
![]()
where:
%CO2 = Measured CO2 concentration measured,
dry basis, percent.
7.4 Average Adjusted NOx Concentration.
Calculate the
average adjusted NOx
concentration by summing the
adjusted values for each sample point and dividing by the number of points for
each run.
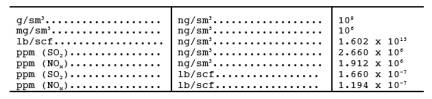
7.5 NOx and SO2 Emission Rate Calculations.
The emission
rates for NOx
and SO2 in units of
pollutant mass per quantity of heat input can be calculated using the pollutant
and diluent concentrations and fuel-specific F-factors based on the fuel
combustion characteristics. The measured concentrations of pollutant in units
of parts per million by volume (ppm) must be converted to mass per unit volume
concentration units for these calculations. Use the following table for such
conversions:
CONVERSION
FACTORS FOR CONCENTRATION
![]()
7.5.1 Calculation of Emission Rate Using Oxygen
Correction. Both the O2
concentration and the
pollutant concentration must be on a dry basis. Calculate the pollutant
emission rate, as follows:
![]()
where:
E = Mass emission
rate of pollutant, ng/J (lb/106 Btu).
7.5.2 Calculation of Emission Rate Using Carbon
Dioxide Correction. The CO2
concentration and the
pollutant concentration may be on either a dry basis or a wet basis, but both
concentrations must be on the same basis for the calculations. Calculate the
pollutant emission rate using Equation 20-7 or 20-8:
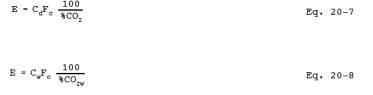
where:
C w = Pollutant concentration measured on a
moist sample basis, ng/sm3
(lb/scf).
%CO2W = Measured CO2 concentration measured on
a moist sample basis, percent.
8. BIBLIOGRAPHY
1. Curtis, F. A Method for Analyzing NOx
Cylinder Gases--Specific Ion Electrode Procedure, Monograph available from
Emission Measurement Branch, ESED, Research Triangle Park, NC 27711. October
1978.
2. Sigsby, John E., F.M. Black, T.A. Bellar,
and D.L. Klosterman. Chemiluminescent Method for Analysis of Nitrogen Compounds
in Mobile Source Emissions (NO, NO2 , and NH3). Environmental Science and
Technology. 7:51-54. January 1973.
3. Shigehara, T.T., R.M Neulicht, and W.S.
Smith. Validating Orsat Analysis Data from Fossil Fuel-Fired Units. Emission
Measurement Branch, Emission Standards and Engineering Division, Office of Air
Quality Planning and Standards, U.S. Environmental Protection Agency, Research
Triangle Park, NC 27711. June 1975.
Figure
20-1 Measurement System Design
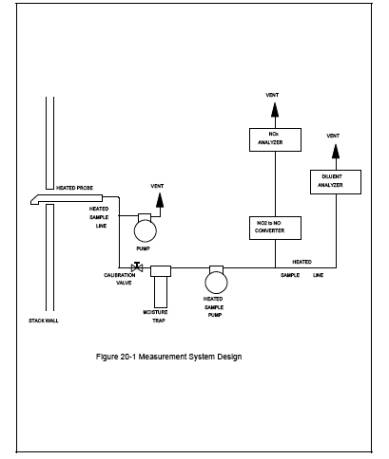
Figure 20-2 Analysis of Calibration Gases Date
Figure
20-3 Zero and Calibration Data
Table
20-1 Interference Test Gas Concentration
Figure
20-4 Interference Response
Table
20-2 Cross-Sectional Layout for Rectangular Stacks
Figure
20-6 Preliminary Diluent Traverse
Figure
20-7 Stationary Gas Turbine Data
Figure
20-8 Stationary Gas Turbine Sample Point Record