Plain English Guide to the Part 75 Rule
U.S.
Environmental Protection Agency
Clear
Air Markets Division
1200
Pennsylvania Avenue, NW
Washington,
DC 20460
September,
2005
TABLE of CONTENTS
SECTION 1:
INTRODUCTION
1.1 What is the purpose of this guide?
1.2
What is Part 75 and who must comply with it?
1.3
What is a cap and trade program?
1.4 Why is continuous monitoring
necessary?
1.5 How is the Part 75 rule
structured?
1.6 What other Federal regulations
interface with Part 75?
SECTION 2:
OVERVIEW OF PART 75 MONITORINGREQUIREMENTS
2.1
Register the Affected Unit(s) with EPA
2.2
Select a Monitoring Methodology
Oil-fired
and gas-fired peaking units
Certain
oil-fired and gas-fired units
Certain
Acid Rain Program units
Affected
coal-fired units under the CAMR rule
Certain
affected units under CAMR
Alternative
Monitoring Systems
2.3 Install and Certify Monitoring
Systems
2.4 Monitor and Record Emissions Data
2.5 Conduct Quality Assurance/Quality
Control Procedures
SECTION 3: BASIC CONTINUOUS EMISSION MONITORING REQUIREMENTS
3.1 What is a continuous emission
monitoring system (CEMS)?
3.2 What is a sorbent trap monitoring
system?
3.3 Primary and Backup Monitoring
Systems
3.4 How must a CEMS be operated?
3.5 How are emissions and heat input
rates determined from CEMS data?
3.6 When are corrections for stack
gas moisture content required?
3.7 What if a unit has multiple
stacks or shares a stack with other units?
3.8 What are the missing data
procedures for CEMS?
SECTION 4: APPENDIX D METHODOLOGY
FORGAS-FIRED
4.1 What is a “gas-fired” or
“oil-fired” unit?
4.2 What is the Appendix D
alternative monitoring method?
4.3 How is the fuel flow rate
measured?
4.4 What are the fuel sampling
requirements of Appendix D?
4.5 How is the SO2 mass emission rate calculated?
4.6 How is the unit heat input rate
calculated?
4.7 Which sulfur content, GCV and
density values are used in the calculations?
•
The results of the fuel
sampling and analysis are used directly in the calculations.
•
An “assumed value” is
used in the calculations.
4.8 What are the ongoing
quality-assurance requirements of Appendix D?
4.9 What are the missing data
procedures for an Appendix D unit?
SECTION 5: APPENDIX E METHODOLOGY FOR
GAS-FIRED AND OIL-FIRED PEAKING UNITS
5.2 How is an Appendix E correlation
curve constructed?
5.3 How are hourly NOx emissions determined?
5.4 What are the fuel sampling
requirements of Appendix E?
5.5 What are the on-going
quality-assurance requirements of Appendix E?
5.6 What are the missing data
procedures for an Appendix E unit?
5.7 What happens if an Appendix E
unit loses its peaking unit status?
SECTION 6: LOW
MASS EMISSIONS METHODOLOGIES
6.1 Gas-Fired and
Oil-Fired Units
6.1.1 What is a low mass emissions
(LME) unit?
6.1.2 How does a unit qualify for LME
status?
6.1.3 How are emissions and heat input
calculated for an LME unit?
Generic
vs. Site-Specific Default Emission Rates
6.1.4 How are site-specific default NOx emission rates determined
6.1.5 Which site-specific default
emission rates are used for reporting?
6.1.6 What are the recordkeeping and
reporting requirements for LME units?
6.1.7 What are the on-going QA/QC
requirements for LME units?
6.1.8 What happens if a low mass
emissions unit loses its LME status?
SECTION 7: PART 75
MONITORING SYSTEM CERTIFICATION
PROCEDURES
7.1 How are Part 75 monitoring
systems certified?
7.2 Step 1 - Submit an Initial
Monitoring Plan
7.3 Step 2 - Submit Certification
Test Notices
7.4 Step 3 - Conduct Certification
Testing
7.5 Step 4 - Submit Certification
Application
7.6 Step 5 - Receive Agency Approval
or Disapproval
7.7 What reference test methods and
standards are used for certification testing?
Fuel
Flowmeter Accuracy standards
7.8 What performance specifications
must be met for certification?
7.9 What is meant by the “span
value”, and why is it important?
7.10 Recertification
and Diagnostic Testing
SECTION 8: QUALITY
ASSURANCE AND QUALITY
8.1 Does Part 75 require periodic
quality QA/QC testing after a monitoring
system is certified ? If so, where are these test requirements found?
8.2 What are the on-going QA test
requirements in Part 75 for units reporting
8.3 Are there any exceptions to these
basic QA test requirements?
8.4 Are there any special
considerations when performing these basic QA tests?
8.5 What are the on-going QA test
requirements for ozone season-only reporters?
8.6 What performance
specifications must be met for the routine QA tests required by Part 75?
8.7 Are there any notification
requirements for the periodic QA tests?
8.8 What are the essential elements
of a Part 75 QA/QC program?
SECTION 9: MISSING
DATA SUBSTITUTION PROCEDURES
9.1 Does Part 75 require emissions to
be reported for every unit
operating hour?
9.2 How are emissions data reported
when a monitoring system
9.3 What are the Part 75 missing data
procedures for CEMS?
9.4 What are the missing data
procedures for Appendices D, E, and G?
9.5 What is conditional data
validation?
SECTION 10: PART
75 REPORTING REQUIREMENTS
10.1 What are the basic reporting
requirements of Part 75?
10.2 How does EPA evaluate the electronic
quarterly reports?
10.4 Electronic Reporting—Update
APPENDIX I: Regulatory Update (CAIR and CAMR Rules)
APPENDIX II: Summary of Part 75 Monitoring Requirements for Common
and Multiple Stack
Configurations
APPENDIX III: On-Going QA Test Requirements for
ACRONYMS and UNITS of
MEASURE
AAR - Authorized Account
Representative
AGA - American Gas
Association
API - American Petroleum
Institute
ARP - Acid Rain Program
ASME - American Society of
Mechanical Engineers
ASTM - American Society of
Testing and Materials
BAF - Bias Adjustment
Factor
CAIR - Clean Air
Interstate Regulation
CAMD - Clean Air Markets
Division
CAMR - Clean Air Mercury
Regulation
CDV - Conditional Data
Validation
CEM - Continuous Emission
Monitoring
CEMS - Continuous Emission
Monitoring System
CFR - Code of Federal
Regulations
CO2 - Carbon Dioxide
DAHS - Data Acquisition
and Handling System
DP - Differential Pressure
DR - Designated Representative
EDR - Electronic Data
Reporting
EGU - Electric Generating
Unit
EPA - Environmental
Protection Agency
ETS - Emissions Tracking
System
GCV - Gross Calorific
Value
GHR - Gross heat Rate
GPA - Gas Processors
Association
Hg - Mercury
ISO - International Organization
for Standardization
LME - Low Mass Emissions
MDC - Monitoring Data
Checking
MER - Maximum Potential
Emission Rate (MER)
NBP - NOx Budget Trading Program
NIST - National Institute
of Standards and Technology
NSPS - New Source
Performance Standards
NOx - Nitrogen Oxides
O2 - Oxygen
OOC - Out-of-Control
PLC - Programmable Logic
Controller
PMA - Percent Monitor Data
Availability
PNG - Pipeline Natural Gas
QA/QC - Quality
Assurance/Quality Control
RA - Relative Accuracy
RATA - Relative Accuracy
Test Audit
RM - Reference method
SIP - State Implementation
Plan
SO2 - Sulfur Dioxide
TTFA - Targeting Tool for
Field Audits
WAF - Wall Effects
Adjustment Factor
Btu - British thermal unit
dscfh - Dry standard cubic
feet per hour
dscf/mmBtu - Dry standard cubic
feet per million Btu
lb/hr - Pounds per hour
lb/mmBtu - Pounds per
million Btu
lb/scf - Pounds per
standard cubic foot
mmBtu/hr - Million Btu per
hour
ppmv - Parts per million
by volume
scfh - Standard cubic feet
per hour
scf CO2/mmBtu - Standard cubic feet of CO2 per million Btu
tons/hr - Tons per hour
tons/scf - Tons per
standard cubic foot
:g/scm - Micrograms per
standard cubic meter
1.1 What is the purpose
of this guide?
EPA
has developed this plain-English guide as a “road map” to help interested
parties navigate through the complex Part 75 continuous emission monitoring
rule. This guide may be useful to people responsible for complying with the
rule, regulatory agencies assessing compliance with the rule, and others who
want a general understanding of the emissions monitoring approach used in EPA’s
emissions trading programs. This guide, although quite comprehensive, does not
replace the Part 75 rule. Rather, it provides a general overview of Part 75 and
is intended to clarify the regulation. To gain a more complete understanding of
the rule, it is necessary to carefully read and study Part 75, as well as the
associated guidance documents issued by EPA, such as the “Part 75 Emissions
Monitoring Policy Manual” and the “Electronic Data Reporting Instructions”).
For further information on EPA’s emissions trading programs, continuous
emissions monitoring, Part 75, and related topics, see the EPA Clean Air
Markets Division (CAMD) website at: www.epa.gov/airmarkets
1.2 What is Part 75 and
who must comply with it ?
The
Part 75 continuous emission monitoring rule, which is found in Volume 40 of the
Code of Federal Regulations (CFR), was originally published in January, 1993.
The purpose of the regulation was to establish continuous emission monitoring
(CEM) and reporting requirements under EPA’s Acid Rain Program (ARP), which was
instituted in 1990 under Title IV of the Clean Air Act. The ARP regulates
electric generating units (EGUs) that burn fossil fuels such as coal, oil and
natural gas and that serve a generator > 25 megawatts. For these units, Part
75 requires continuous monitoring and reporting of sulfur dioxide (SO2) mass emissions, carbon dioxide (CO2) mass emissions,
nitrogen oxides (NOx) emission rate, and heat input. The SO2 component of the ARP is a “cap and trade” program, designed to reduce
acid deposition by limiting SO2 emission levels in the “lower
48" states of the U.S.
In
October, 1998, EPA added Subpart H to Part 75, which provides a blueprint for
the monitoring and reporting of NOx mass emissions and
heat input under a State or Federal NOx emissions reduction
program. The Agency anticipated that such programs were likely to come into
existence, due to growing concern over health hazards associated with NOx emissions from power plants and large industrial sources. NOx is a precursor to ozone and fine particulate matter formation. Subpart H
has since been adopted as the required monitoring methodology for NOx mass emissions and heat input under the NOx Budget
Trading Program (NBP).
The
NBP is a NOx cap and trade program, designed to limit ground-level
ozone formation during the ozone season (from May 1st through September 30th) in 22 states in the Eastern U.S.
The state regulations for the NBP apply mainly to large EGUs and industrial
boilers, although certain states have included other categories of NOx-emitting sources, such as cement kilns and
On May 12 and May 18,
2005, EPA published two new air regulations, the Clean Air Interstate Rule
(CAIR) and the Clean Air Mercury Rule (CAMR). These regulations provide model
rules for cap and trade programs that can be adopted by the states. The CAIR
rule seeks to reduce fine particulate and ozone emissions by imposing tight
emission caps on SO2 and NOx mass emissions from EGUs in 28
states. CAIR includes annual SO2 and NOx emissions caps for 23 of the 28 affected states and an ozone season cap
on NOx emissions in 25 of the states. The AMR rule seeks to
achieve substantial reductions in mercury (Hg) mass emissions from coal-fired
EGUs in all 50 states.
Both CAIR and CAMR require
Part 75 monitoring. Under CAIR, monitoring systems for NOx mass emissions and heat input must be installed and certified by 2008,
and monitoring systems for SO2 mass emissions and heat input
must be certified by 2009. Under CAMR, Part 75-compliant monitoring systems for
Hg mass emissions and, if required, heat input must be installed and certified
by January 1, 2009. For a further discussion of these new rules, see Appendix I of this guide.
Part 75 specifies the
types of continuous monitoring systems that may be used for each parameter (SO2, NOx, Hg, etc.) and sets forth the operation, maintenance
and quality assurance/quality control (QA/QC) requirements for each system. In
most cases, continuous emission monitoring systems (CEMS) are required, although
in some instances, other monitoring methodologies are allowed.
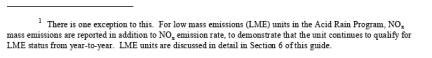
Table 1 summarizes
the various programs that require (or will require) Part 75 monitoring. Each of
these programs requires certain parameters to be monitored over specified time
periods. For each affected unit, the specific parameters that must be
monitored, the units of measure, and the averaging (or accounting) periods
depend on which program(s) apply.
Table 1 also shows
that when the same pollutant is regulated under two different programs, the
Part 75 monitoring and reporting requirements for the pollutant are not
necessarily consistent between the two programs. For example, the ARP and NBP
assess NOx compliance differently. The ARP requires the NOx emission rate to be monitored and reported in pounds per million Btu
(lb/mmBtu) and specifies annual NOx emission rate
limits for certain coal-fired EGUs, under 40 CFR Part 76. But the ARP does not
have an emissions trading component for NOx, and therefore does
not require NOx mass emissions to be reported1. Conversely, the NBP, which is a NOx cap and trade
program, does require NOx
mass emissions to be monitored and
reported for allowance accounting purposes, but does not require compliance
with NOx emission limits in lb/mmBtu. For sources subject to
both the ARP and the NBP, the requirements of both programs must be met --
therefore, NOx mass emissions and NOx emission rate
must both be monitored and reported.
___________________
1.3 What is a cap and
trade program?
A cap and trade
program is a market-based approach to reducing emissions. The concept is
simple: EPA caps, or limits, the total annual or seasonal mass emissions of a
pollutant such as SO2, NOx or Hg. The cap is divided into
emission allowances that are allocated to each affected source. Each emission
allowance represents an authorization to emit one ton of SO2 or NOx, or one ounce of Hg over a specified time period
(i.e., calendar year or ozone season). To demonstrate compliance, a source is
required to hold a number of allowances greater than or equal to its emissions
in the regulated time period. Since the total number of allowances allocated to
the affected sources is less than the pre-program (“baseline”) mass emissions
from those sources, the program reduces the mass emissions of the regulated
pollutant.
A cap and trade program does not specify traditional numerical emission limits (e.g. ppm, lb/mmBtu, etc.) for the regulated pollutant(s) Instead, compliance is demonstrated by holding enough allowances to cover the total mass emissions from the affected unit(s) during a specified time period. However, numerical emission limits imposed by other programs or by the operating permit still apply.
At the end of each
compliance period, a reconciliation process takes place to verify that each
affected source has enough allowances to cover its emissions. Automatic
penalties for noncompliance are part of the U.S. cap and trade programs. For
example, if an ARP unit does not have enough allowances to cover its annual SO2 emissions, the owner or operator of the unit must pay an excess
emissions penalty and must surrender future year allowances to cover the
shortfall. For a NBP unit, if its ozone season NOx emissions
exceed its allowance holdings, the owner or operator of the unit must surrender
at least 3 future-year allowances and, if required by state rules, pay
additional penalties.
This market-based
approach allows sources to determine the most cost-effective way to comply.
Sources may reduce emissions by using pollution control technologies, employing
energy conservation measures, reducing utilization, switching fuels, or other
strategies. Sources also are allowed to buy and sell allowances from each other
to ensure that each unit has enough allowance credits in its account to cover
its emissions. In this manner, a cap and trade program reduces emissions at a
lower cost than traditional pollution control regulations and policies, by setting
a goal and allowing market forces to determine how the goal is met.
1.4 Why is continuous
monitoring necessary?
Emissions monitoring
and accounting are the backbone of cap and trade programs. Because the emission
allowances are based on the total mass of a pollutant emitted over a certain
time period, emissions must be monitored continuously during the compliance
period. It is, therefore, essential to have a reliable measurement method for
the commodity being regulated and traded---in this case, emissions--- to ensure
that the goal of achieving actual, measurable emissions reductions in a
cost-effective manner is met. Part 75 provides the necessary measurement
method, and gives value to the traded commodity by:
•
Ensuring that the
emissions from all sources are consistently and accurately measured and
reported. In other words, a ton of emissions2 from one source is
equal to a ton of emissions2 from any other source;
•
Ensuring that a
complete record of emission data is produced for each unit in the program
(i.e., data are obtained for every hour of unit operation);
•
Verifying that emission
caps are not exceeded, thereby ensuring that emissions are not underestimated
and that emission reduction goals are being met.
1.5 How is the Part 75
Rule Structured ?
Part 75 consists of
nine Subparts, A through I, followed by a series of eleven Appendices, A
through K3. A brief description of each Subpart and Appendix
follows.
Subparts
Defines the purpose of the regulation and the extent of its
applicability. Subpart A also includes general Acid Rain Program provisions,
compliance dates, prohibitions, and lists various methodologies (e.g., ASTM,
ASME, etc.) that are incorporated into the rule by reference.
Presents the general emission monitoring requirements for each pollutant
(SO2 , NOx , etc.). Special instructions
are given for monitoring at common stack and multiple stack exhaust
configurations.
___________________
Presents the process for certification and recertification of the
required continuous monitoring systems, provides the quality assurance and
quality control (QA/QC) requirements for the systems, defines “out-of-control”
periods, and requires bias adjustment of data from SO2 , NOx , and flow monitors.
Describes the missing data procedures that are used to determine the
appropriate substitute data values, for unit operating hours in which the
monitoring systems fail to provide quality-assured data.
Describes the requirements that must be met for approval of an
alternative monitoring system.
Contains the recordkeeping requirements
Contains the reporting requirements. Instructions are provided for
submitting notifications, monitoring plans, certification applications,
emissions reports, and special petitions to the Administrator.
Describes the NOx
mass emission monitoring requirements
for sources in a NOx mass emissions reduction program that adopts Part 75,
such as the NOx Budget Program or a NOx trading
program under the CAIR rule. Special instructions are provided for sources that
report data only during the ozone season.
Describes the Hg mass emission monitoring requirements for sources in a
Hg mass emissions reduction program that adopts Part 75, such as a national Hg
trading program under the CAMR rule.
Appendices
Describes CEMS installation and certification test procedures, and
provides performance specifications for the CEMS and explains how to set the
span and range of CEMS;
Describes the required on-going CEMS quality assurance tests and
procedures for CEMS, and includes rules for data validation;
Provides guidelines for parametric and load-based missing data
substitution;
Provides an optional protocol for estimating SO2 mass emissions and heat input for gas-fired and oil-fired units;
Provides an optional protocol for estimating NOx emissions from gas-fired and oil-fired peaking units;
Provides equations for converting raw monitoring data into the
appropriate units of measure;
Gives procedures for monitoring and calculating CO2 mass emissions, for ARP units;
Are currently reserved; and
Provides special operating instructions and quality-assurance
requirements for sorbent trap monitoring systems, which are used to monitor Hg
emissions.
1.6 What other Federal
regulations interface with Part 75?
Part 75 is one of the
Acid Rain Program core rules, which, collectively, are found in Volume 40 of
the CFR, Parts 72 through 78. Part 75 is referenced in several of the other
core rules. First, in §72.2, there are numerous important definitions that
apply to Part 75. Second, Part 76, which specifies annual NOx emission limits for certain coal-fired boilers, requires Part 75
monitoring to be used to demonstrate compliance with these emission limits.
Third, Part 74 requires units that opt-in to the Acid Rain Program to monitor
and report SO2 emissions according to Part 75.
Part 75 also
interfaces with some of the New Source Performance Standards (NSPS) regulations
in 40 CFR Part 60. Many units that are currently in the Acid Rain Program or
the NOx Budget Program are also subject to one of the NSPS
boiler regulations (Subparts D, Da, Db and Dc) or to the NSPS rule for
combustion turbines (Subpart GG). The Part 60 boiler regulations require
continuous emission monitoring for SO2 and/or NOx , and Subpart GG allows a NOx CEMS to be used to
monitor and report “excess emissions”. Subparts Da and Db allow a certified
Part 75 NOx monitoring system to be used to meet the Part 60 NOx monitoring requirements. Subpart GG allows a certified Part 75 NOx CEMS to be used for excess emission monitoring.
2.0
OVERVIEW OF PART 75 MONITORING REQUIREMENTS
Part 75 requires an
hourly accounting of the emissions from each affected unit. Continuous emission
monitoring systems (CEMS) are used to provide the emissions data unless the
unit qualifies to use one of the alternative monitoring methodologies specified
in the rule. With few exceptions, the alternative methodologies apply to
oil-fired and gas-fired units.
The selected
monitoring methodology for each unit must be approved by EPA through a
certification process. Once the methodology has been approved and the required
monitoring systems are certified, the recording and reporting of emissions data
begins. Part 75 also requires on-going quality assurance and quality control
(QA/QC) procedures, to ensure that the data collected by the monitoring systems
continue to be accurate.
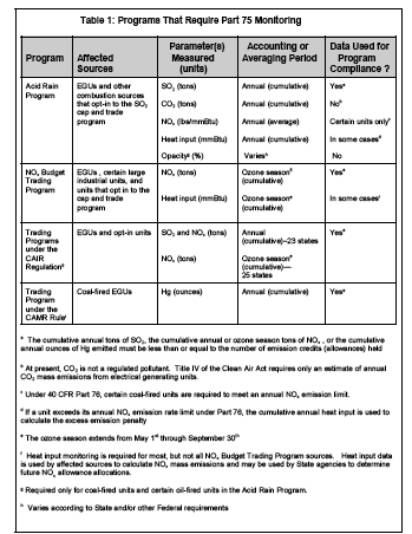
This section provides
an overview and general description of the Part 75 monitoring and reporting
requirements (see Figure 1). More specific information is provided in the
subsequent sections of this guide.
2.1 Register the
Affected Unit(s) with EPA.
Each affected unit
must be registered with EPA’s Clean Air Markets Division (CAMD) before any data
is reported for the unit. As part of the registration process, a Designated
Representative, or “DR” (for the Acid Rain and CAIR Programs), a “Hg Designated
Representative” (for the CAMR Program), or an Authorized Account
Representative, or “AAR” (for the NOx Budget Program),
must be assigned for each unit. The Designated Representative or AAR takes the
responsibility for ensuring that each affected unit complies with all of the
applicable program requirements, and that the emissions data reported to EPA
are true and accurate. For units subject to both the Acid Rain Program and to
one or more of the SO2 and NOx trading programs under CAIR,
the Designated Representative for all of these trading programs must be the
same person.
2.2 Select a Monitoring
Methodology
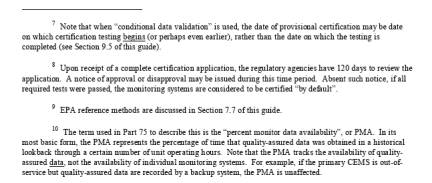
Part 75 provides
several monitoring options. The options that are available for a unit depend on
how the unit is classified (see Table 2 in Section 2.4, below). In general, if
a unit is coal-fired or combusts any type of solid fuel, the basic continuous
monitoring provisions in §§75.10-75.18 require the use of CEMS for all
monitored parameters. However, there are a few exceptions to this. If a unit is
classified as an oil- or gas-fired unit, it may qualify for an alternative
monitoring approach instead of CEMS for some or all parameters. In
some cases, the unit may
even qualify for a monitoring exemption.
The Part 75 rule generally requires
the use of CEMS for units that combust coal or other solid fuel(s). Alternative
monitoring approaches, referred to in the rule as “excepted methods” or
“excepted monitoring systems” , may be used for qualifying oil-fired and
gas-fired units, and for certain coal-fired units under the CAMR rule.
The monitoring
alternatives or exemptions that apply to a unit depend mainly on how often the
unit operates each year, how much it emits, and the type(s) of fuel(s) it
combusts. These alternatives and exemptions are:
•
Monitoring
Options
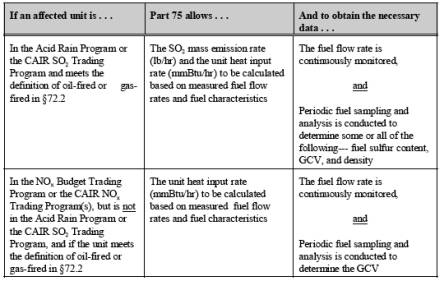
May use the alternative, or “excepted” methodology in Appendix D of Part
75 to determine SO2 mass emissions and/or unit heat input. The Appendix D
method requires continuous monitoring of the fuel flow rate with a certified fuel
flowmeter and periodic fuel sampling and analysis to determine one or more of
the following quantities: (1) the gross calorific value (GCV) of the fuel; (2)
the fuel sulfur content; and (3) the density of the fuel. The Appendix D
methodology is discussed in greater detail in Section 4 of this guide.
•
Oil-fired and
gas-fired peaking units
May use the alternative method in Appendix E of Part 75 to estimate the
hourly NOx emission rate in lb/mmBtu. Appendix E requires hourly
determination of the heat input rate to the unit, using the fuel flow rate
measured by a certified Appendix D fuel flowmeter, in conjunction with the GCV
of the fuel. A correlation curve of NOx emission rate
versus heat input rate (derived from emission testing) is then used to estimate
the hourly NOx emission rates. The Appendix E methodology is
discussed in greater detail in Section 5 of this guide.
•
Certain oil-fired
and gas-fired units
May qualify to use the low mass emissions (LME) methodology in §75.19 to
estimate SO2, CO2, and/or NOx emissions and heat input. To qualify for LME status, a unit’s annual SO2 and NOx mass emissions, and in some cases, its ozone season
NOx mass emissions, must be demonstrated to be below
certain threshold values.
The LME methodology requires
that records be kept of the hours in which the unit operates, the type(s) of
fuel(s) combusted, the electrical or steam load during each of those hours,
and, in some cases, the operational status of the NOx emission controls. Default emission rates and estimates of heat input
are used to quantify the unit’s mass emissions. The LME methodology is
discussed in greater detail in Section 6 of this guide.
May use the alternative procedures in Appendix G of Part 75 to estimate
CO2 mass emissions, in lieu of installing CEMS. Appendix
G allows CO2 emissions to be estimated, either by using: (1) fuel
feed rates and the results of periodic fuel sampling and analysis (to determine
the % carbon in the fuel); or (2) hourly heat input rate measurements from a
certified Appendix D fuel flowmeter and a fuel-specific, carbon-based
“F-factor”.
Appendix G is the most frequently used method for estimating CO2 mass emissions from oil and gas-fired units. Part 75 allows the fuel
feed rate methodology (option (1), above) to be used for coal-fired units also,
but it is not currently being used by any of them.
•
Certain Acid Rain
Program units
Are exempted from opacity monitoring requirements. Coal-fired units with
wet scrubbers may be exempted if the presence of condensed water in the
effluent gas stream interferes with the opacity readings. Also, any unit that
meets the definition of gas-fired or diesel-fired in §72.2, or that qualifies
as a dual-fuel reciprocating engine is exempted from opacity monitoring.
However, note that these Part 75 exemptions do not supersede the provisions of
any other program, regulation, or permit that may require an opacity monitor to
be installed.
•
Affected
coal-fired units under the CAMR rule
May use an alternative (“excepted”) type of continuous Hg monitoring
system, known as a “sorbent trap monitoring system”. A sorbent trap system
continuously samples the stack gas for an extended period of time (e.g., up to
a week or more) and collects Hg on a sorbent medium such as activated carbon.
The total volume of stack gas sampled during the collection period is measured,
and the Hg concentration is determined by taking the ratio of the collected Hg
mass to the sample volume.
•
Certain affected
units under CAMR
May qualify to use a low mass emissions methodology to estimate the
annual Hg mass emissions, in lieu of continuously monitoring the Hg
concentration. This alternative methodology applies mainly to small units with
very low (< 29 lb/yr) annual Hg mass emissions. It requires periodic
Hg emission testing, and conservatively high default Hg concentrations must be
used for emissions reporting.
Sections 3 through 6 of this guide provide more information on the various Part 75 emission monitoring methodologies. Section 3 describes the basic CEM provisions, and Sections 4, 5, and 6, respectively, discuss the alternative Appendix D, Appendix E, and low mass emission methodologies.
Under §75.66, EPA has
established a petition process through which affected sources can request
relief or variances from certain provisions of Part 75. Each petition must
contain sufficient information for the Agency to evaluate the request. At a
minimum, the petition must: (1) identify the affected facility and unit(s); (2)
explain why the proposed alternative is being suggested instead of the
regulatory requirement; (3) provide a description of any equipment or
procedures used in the proposed alternative; (4) demonstrate that the proposed
alternative is consistent with the purposes of Part 75 and the Clean Air Act;
and (5) explain why approving it will not have any significant adverse effects.
The regulatory
flexibility provided by the petition process reduces the cost of compliance for
many sources and facilitates program implementation. EPA strives for
consistency in its petition responses. When a petition is approved (or denied),
petitions of a similar nature will also be approved (or denied). The Agency
also seeks to avoid setting precedents by answering petitions in a way that
will weaken or undermine the Part 75 rule. Finally, when EPA approves a large
number of petitions of the same type, this often indicates the need for a rule
change. The Agency has revised Part 75 a number of times on this basis.
Alternative Monitoring
Systems
Subpart E of Part 75
allows sources to petition EPA for approval of an alternative monitoring
system. To obtain approval, the petition must demonstrate that the alternative
system has the same precision, reliability, accessibility, and timeliness as a
certified Part 75 CEMS. The performance of any alternative system must be
demonstrated by simultaneous testing against a fully certified CEMS or an EPA
reference test method. The petition must also propose quality assurance
procedures and missing data substitution procedures for the alternative
monitoring system that are consistent with the corresponding Part 75 procedures
for CEMS. The criteria and procedures for approval of alternative systems are
specified in Subpart E and are not discussed further in this guide.
On the one hand, EPA has received
and approved only a few Subpart E petitions to use alternative monitoring
systems, partly due to the rigorous requirements of Subpart E and partly
because the Appendix D, Appendix E and LME “excepted” methods in Part 75
provide substantial flexibility in choosing a monitoring methodology. On the
other hand, the Agency has approved many minor variations to the monitoring
provisions of Part 75
2.3 Install and Certify
Monitoring Systems
Before any monitoring
methodology or monitoring system is used, it must be approved through a
certification process. This process is described in detail in Section 7 of this
guide. Except for LME units4, the general steps for
obtaining certification are:
•
Step 1---Prepare and
submit an initial monitoring plan
•
Step 2---Submit
certification test notices
•
Step 3---Conduct
certification testing
•
Step 4---Submit a
certification application
•
Step 5---Receive
approval or disapproval
2.4 Monitor and Record
Emissions Data
With the exception of
LME units5, monitoring and reporting of emissions begins as
soon as certification testing is successfully completed, provided that the
tests are completed by the certification deadline specified in the regulations6. Part 75 monitoring systems are considered to be “provisionally
certified” in the period extending from the date of successful completion of
the
![]()
____________________
certification tests7 through the end of a 120-day review period8, provided
that the systems are operated in accordance with all Part 75 requirements and
the permitting authority does not disapprove the systems in the meantime.
Emissions data may be reported as quality-assured during this period of
provisional certification.
Part 75 requires
emissions data to be reported for every hour that an affected unit is
operating, including periods of start-up, shutdown, and malfunction. If one of
the required monitoring systems is not working or is out-of-control (e.g., if
it fails one of its required quality assurance tests), data from an approved
backup monitor or from an EPA reference method9 may be
reported. If quality-assured data from a back-up monitor or reference method
are not available, the Part 75 missing data substitution procedures must be
used to estimate emissions.
The Part 75 missing
data routines for CEMS are found in §§75.31 through 75.38 and the routines for
sorbent trap monitoring systems are found in §75.39. These routines consist of
mathematical algorithms that are used to determine an appropriate substitute
value for any unit operating hour in which quality-assured data are not
obtained for a monitored parameter (i.e., for SO2 , NOx, Hg, CO2, O2 , flow rate, or moisture).
Generally speaking, historical, quality-assured monitoring data are used to
determine the substitute data values. The exact substitute data values that are
applied in a given situation depends on:
•
The historical
availability of quality-assured data from the monitor(s)10;
•
The length of the missing
data period; and
•
For certain parameters
(NOx and flow rate), the hourly unit loads during the
missing data period.
The missing data
procedures are designed to be conservative. This provides an incentive to
reduce periods of monitor downtime, by rewarding high percent monitor data
availability (PMA)10. The procedures will produce conservatively high
emissions estimates for units with lower PMA values. The monitoring
methodologies in Appendices D, E, and G of Part 75 also have missing data
procedures. The missing data algorithms under these appendices are considerably
less complex than the CEMS and sorbent trap system algorithms. The Part 75
missing data substitution procedures are discussed in greater detail in Section
9 of this guide.
__________________
2.5 Conduct Quality
Assurance/Quality Control Procedures
After certification,
the following periodic performance evaluations of all monitoring systems must
be conducted, to ensure the continued accuracy of the emissions data:
•
The quality-assurance
tests for CEMS include daily assessments (e.g., calibration error tests),
weekly assessments (system integrity checks of Hg CEMS equipped with
converters), quarterly assessments (e.g., linearity checks), and semi-annual
(or annual in some cases) relative accuracy test audits (RATAs);
•
For sorbent trap
monitoring systems, annual RATAs and the quality assurance procedures of Part
75, Appendix K are required;
•
For CAMR units that
qualify to use the Hg low mass emissions option, either semiannual or annual Hg
emission testing is required, depending on the annual mass emission level;
•
For Appendix D fuel
flowmeters, annual accuracy tests are required; and
•
For Appendix E units
and LME units using site-specific emission rates, re-testing is required once every
5 years.
Note that for
linearity checks, RATAs, and fuel flowmeter accuracy tests, test exemptions and
test deadline extensions are permitted by Part 75 in certain circumstances. The
required QA tests for Part 75 monitoring systems are discussed in greater
detail in section 8 of this guide.
For all required
continuous monitoring systems, a written quality assurance (QA) plan must be
developed and followed. The quality control plan includes step-by-step
procedures for each of the required QA tests, as well as procedures for
calibration adjustments, preventive maintenance, audits, recordkeeping and
reporting.
The basic record
keeping provisions of Part 75 are found in Subpart F (§75.53 and §§75.57
through 75.59). Most of the required records are kept electronically, for a
minimum of three years, using a data acquisition and handling system (DAHS),
although some monitoring plan information and quality assurance (QA) test
support data is kept in hard copy. The DAHS records all data from the
monitoring systems, translates it into the required units of measure, and
stores the data. When emissions data are missing, the DAHS automatically
performs missing data substitution. The DAHS also electronically records and
stores operating data for the combustion unit, emission control device data,
monitoring plan data, and the results of QA checks and tests.
Parallel
recordkeeping sections, that frequently cite the basic Subpart F provisions,
are found in §75.73 of Subpart H (for NOx mass trading
programs such as the NBP) and in §75.84 of Subpart I (for mercury mass trading
programs such as the CAMR). The NBP, CAIR and CAMR rules also include
recordkeeping sections, but in general, these sections contain no new or unique
requirements. Rather, they serve as “road signs”, pointing back to the
recordkeeping provisions in Subparts F, H, and I.
The electronic
records that must be maintained are quite detailed and are not discussed
further in this guide. Typically, DAHS vendors can provide software that meets
the Part 75 recordkeeping requirements.
The basic Part 75
reporting provisions (originally written for the ARP) are found in Subpart G
(§§75.60 through 75.64). Subpart G includes requirements to provide various
types of notifications and to submit monitoring plans, certification
applications, and electronic emissions reports at specified times. Parallel
notification and reporting sections, which reference sections of Subpart G, are
found in §§75.73 and 75.74 of Subpart H (for NOx trading
programs such as the NBP), and in §75.84 of Subpart I (for mercury trading
programs such as the CAMR).
The NBP, CAIR and
CAMR rules also include notification and reporting sections, but these sections
simply reference the notification and reporting provisions in Subparts G, H,
and I of Part 75. The CAIR SO2 rule refers to Subpart G; the
NBP and CAIR NOx rules refer to Subparts G and H; and the CAMR rule
refers to Subpart I.
For units under the
Acid Rain Program and/or the CAIR annual SO2 and NOx trading programs, emissions reports must be submitted four times a year,
i.e., one report for each calendar quarter. Units that are subject to the NOx Budget Program or to the CAIR ozone season NOx trading program, but are not in either the Acid Rain Program or the CAIR
annual SO2 and NOx programs, have the option of
reporting emissions data either year-round or only for the ozone season (May 1st through September 30th).
The quarterly reports
allow EPA to track the quality of the emissions data throughout the year (or
ozone season) as well as the status of emissions compared to the allowances
held. The data and information to be reported include the following:
•
Facility information;
•
The hourly emissions data,
operating data, the results of the required QA tests, and other information
specified in the monitoring plan and recordkeeping sections of Part 75;
•
Unit operating hours
for the quarter and cumulative operating hours for the calendar year and/or
ozone season;
•
Tons of SO2 emitted during the quarter and cumulative SO2 mass emissions for the calendar year (ARP units and units in the CAIR SO2 Trading Program, only);
•
Average NOx emission rates (lb/mmBtu) for the quarter and for the year-to-date (ARP
units, and certain units in the NBP and CAIR NOx Trading
Programs);
•
Tons of CO2 emitted during the quarter and cumulative CO2 mass emissions for the calendar year (ARP units, only);
•
Tons of NOx emitted during the quarter and cumulative NOx mass emissions for the calendar year and/or ozone season, as applicable
(for units in the NBP and CAIR NOx Trading Programs);
•
Ounces of Hg emitted
during the quarter and cumulative Hg mass emissions for the calendar year (CAMR
units, only); and
•
Total heat input
(mmBtu) for quarter and cumulative heat input for calendar year (or ozone
season)—unless exempted from heat input reporting by regulation.
EPA requires the data
be submitted electronically, because of the large volume of information that
must be reported. The Agency provides a standard electronic data reporting
(EDR) format that must be used and provides monitoring data checking (MDC)
software that can be used to perform quality control checks on the data prior
to data submittal. While use of the MDC software is optional, EPA encourages it
because using the MDC will cut down on the number of re-submissions and save
time and money. EPA processes each quarterly report through rigorous quality
control checks to verify data accuracy and conformance to the required format.
After the review, the Agency sends notifications to the affected sources,
indicating whether the quarterly data are acceptable or unacceptable. The Part
75 reporting requirements are discussed in more detail in Section 10 of this
guide.
3.0
BASIC CONTINUOUS EMISSION MONITORING REQUIREMENTS
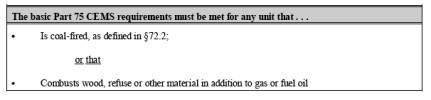
The basic Part 75
continuous monitoring approach is to install CEMS and a DAHS on each affected
unit and record emissions and heat input data. This general approach must be
followed for combustion units that burn coal or any other solid fuel11 (see Table 3). Oil-fired and gas-fired units may either comply with
these basic requirements or may use alternative monitoring methods for some or
all parameters (see Sections 4, 5, and 6 of this guide for further discussion
of the alternative methods).
Table 3: Units that Must Comply with the Basic Part 75
CEMS
Requirements
3.1 What is a
continuous emission monitoring system (CEMS)?
A continuous emission
monitoring system, or CEMS, consists of all the equipment needed to measure and
provide a permanent record of the emissions from an affected unit. Examples of
CEMS components include:
•
Pollutant concentration
monitors (e.g., SO2 , NOx, or Hg monitors).
•
Diluent gas monitors,
to measure %O2 or %CO2
•
Volumetric flow
monitors
•
Sample probes
•
Sample (“umbilical”)
lines
•
Sample pumps
•
Sample conditioning
equipment (e.g., heaters, condensers, gas dilution equipment)
•
Data loggers or
programmable logic controllers (PLCs)
•
DAHS components that
electronically record all measurements and automatically calculate and record
emissions and heat input in the units of measure required by the rule.
____________________
The specific
components of a CEMS depend upon the parameter being monitored, the measurement
principle of the CEMS, and the required units of measure. Some components are
common to all systems, while others are specific to a particular monitoring
technology. To illustrate:
•
The key components of
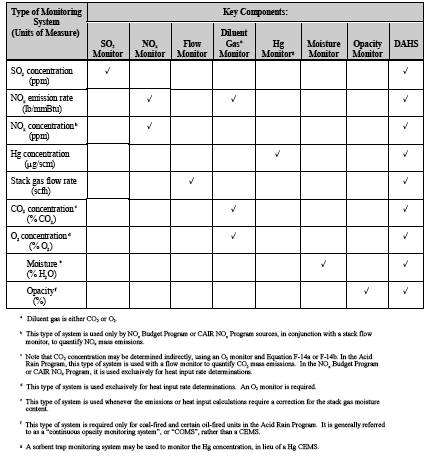
every Part 75 CEMS are the analyzer(s) and the DAHS (see Table 4). Table 4
shows that all Part 75 CEM systems, except for one, have only one component
monitor. The exception is the NOx emission rate, or “NOx diluent” monitoring system, which measures NOx in lb/mmBtu. This system includes both a NOx monitor and a diluent gas monitor (either CO2 or O2).
•
PLCs and data loggers
are common to all types of CEMS
•
Probes, sample lines,
vacuum pumps and sample conditioning equipment are associated with “extractive”
CEMS, which continuously withdraw a sample of the effluent gas from the stack
and send it to an analyzer located in a climate controlled environment (i.e., a
“CEMS shelter”).
•
“In-situ” CEMS, which
analyze the effluent gas at stack conditions, sometimes have probes12, but unlike extractive systems, do not require sample lines, sample conditioning
equipment, etc.
•
Extractive CEMS that
measure on a dry basis require moisture removal systems, whereas wet basis
extractive systems13 do not.
The number of
required monitors can sometimes be minimized by sharing certain components
among two or more monitoring systems. For example, data from a single diluent
gas monitor could be used to calculate NOx emission rate and
CO2 mass emissions.
____________________
3.2 What is a sorbent
trap monitoring system?
As previously noted
in Section 2.2, above, a sorbent trap monitoring system is an alternative type
of continuous Hg monitoring system that may be used instead of an Hg CEMS, for
any affected unit under the CAMR rule. A sorbent trap system continuously samples
the stack gas for an extended period of time (anywhere from several hours to
several days, depending on the Hg concentration in the stack). Mercury is
collected inside a tube (“trap”) that is filled with a sorbent medium such as
activated carbon, and a dry gas meter is used to measure the total volume of
dry stack gas sampled during the data collection period.
The sorbent trap
system is similar to an extractive-type CEMS, in that it continuously samples
the stack gas and uses a moisture removal system. However, the similarity ends
there, as the sorbent trap system differs from a CEMS in many ways. First, it
does not measure the real-time Hg concentration every hour. Rather, it gives
only an average Hg concentration over the data collection period, and this
average concentration cannot be known until the sorbent traps have been
analyzed in the lab. Second, unlike a CEMS, which samples at a constant rate,
the sample flow rate through a sorbent trap is varied during the collection
period, in proportion to the stack gas volumetric flow rate. Third, paired
sorbent trap systems must be run simultaneously during each data collection
period, and the Hg concentrations obtained from the two systems must agree to
within a specified tolerance to validate the data. Finally, the certification
and ongoing quality-assurance test requirements for sorbent trap systems are
considerably different from those for an Hg CEMS. The only QA test common to
both types of systems is the RATA. The certification and QA test requirements
for Hg monitoring systems are discussed further in Sections 7 and 8 of this
guide.
3.3 Primary and Backup
Monitoring Systems
For each monitored
pollutant or parameter, Part 75 requires that a primary monitoring system be
designated. Data from the primary system must be reported if it is in-service.
However, when the primary system is not able to provide quality-assured data,
data from one of the following types of backup monitors or monitoring systems
may be reported:
•
Redundant backups. A redundant backup monitoring system is a fully
certified, stack- or duct-mounted system that continuously records data and is
kept on “hot stand-by” in case of a primary system outage. A redundant backup
monitoring system is operated, maintained and quality-assured in the same
manner as the primary system.
•
Non-redundant
backups. A non-redundant backup
monitoring system is a certified system that does not operate continuously.
Rather, it is kept on “cold stand-by”, and must pass a substantive quality-assurance
test each time it is brought into service. For example, before a non-redundant
backup gas monitoring system can be used for Part 75 reporting, it must pass a
linearity check. The use of a non-redundant backup system is restricted to 720
hours per year at a given unit or stack location.
•
Like-kind
replacement analyzers. A
like-kind replacement analyzer is a gas analyzer of the same type as the
primary (i.e., it monitors the same parameter by the same measurement
principle). A like-kind replacement analyzer may be used for short periods of
time when the primary analyzer malfunctions or needs maintenance. The
replacement analyzer does not require certification, provided that it is
connected to the same probe and sample interface as the primary analyzer, and
that it is not used for more than 720 hours per year at a particular unit or
stack location. A linearity check of the analyzer is required each time it is
brought into service.
•
Reference method
backups. EPA reference test
methods (e.g., Method 6C for SO2 or Method 7E for NOx) may be used to provide quality-assured data during CEMS outages.
Although it might
save money initially, failure to have backup or redundant monitoring equipment
could result in over-reporting of emissions in the long run. For example,
suppose that the same CO2
monitor is used to determine both CO2 mass emissions and NOx emission rate. When the CO2 monitor malfunctions, the missing data procedures for both NOx and CO2 must be applied, since the systems for NOx and CO2 are considered to be out-of-control. As previously
noted, the Part 75 missing data procedures tend to produce increasingly more
conservative (i.e., conservatively high) emissions estimates as the PMA
decreases. Therefore, long missing data periods may result in significant
over-reporting of emissions and loss of allowance credits.
3.4 How must a CEMS be
operated?
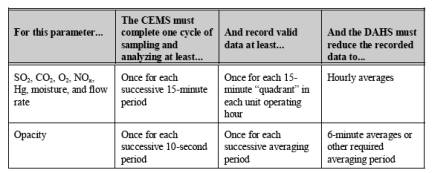
The minimum operating
and data capture requirements for Part 75 CEM systems are summarized in Table
5. In general, the CEMS must be operated at all times when the unit is
combusting fuel, except when the monitors are being calibrated, maintained, or
repaired. As previously noted, each CEMS must be equipped with an automated
DAHS, to record the emissions data and to reduce it to hourly averages14. To make an hourly average, at least one valid data point (generally,
this means a valid one-minute average) is required in each 15-minute quadrant
of the hour in which the unit operates.15 A single DAHS is
usually sufficient to manage data for all the parameters that must be
monitored.
___________________
Table
5: Minimum Operating and Data Capture Requirements
for
Part 75 CEMS
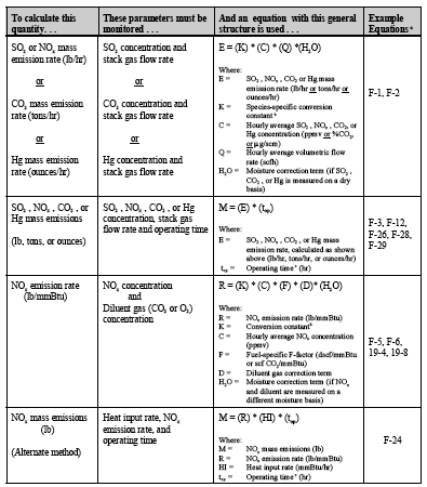
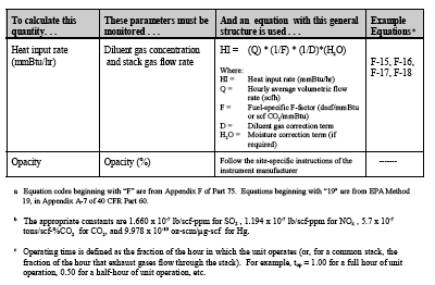
3.5 How are emissions
and heat input rates determined from CEMS data?
The methods for determining
emissions and heat input rates are shown in Table 6. This table presents the
general equations used to convert monitoring data into the units of measure
required by Part 75. The equations are somewhat different for each parameter
monitored, but are based on the same principles. These principles are explained
below.
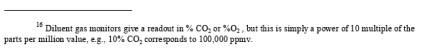
The gas monitors
required by Part 75 (i.e., SO2 , NOx , CO2 and O2) measure concentration in parts
per million by volume (ppmv)16, with one exception---Hg
monitors measure concentration in micrograms per standard cubic meter (µg/scm).
However, concentration data alone are not sufficient to characterize emissions
under Part 75---the concentrations must be converted into emission rates. The
rule specifies the appropriate conversion factors to use.
The units of the
emission rates are pounds per standard cubic foot (lb/scf) for SO2 and NOx, tons per standard cubic foot (tons/scf) for CO2, and ounces per standard cubic foot (oz/scf) for Hg. These emission
rates are then used to determine the emissions in the units of measure required
by Part 75, i.e., either mass per unit of time (lb/hr, tons/hr, or oz/hr), mass
per unit of heat input (e.g., lb/mmBtu), or simply mass (pounds, tons, ounces).
____________________
Table
6: Calculating Emissions and Heat Input Rate
from
Part 75 CEMS Data
Determining
lb/mmBtu emission rates
To obtain emission
rates in terms of mass per unit of heat input (e.g., NOx emission rate in lb/mmBtu), the emission rate in lb/scf is multiplied by
a fuel-specific “F-factor.” The F-factor relates the volume of stack gas or CO2 produced by combustion to the caloric heat content of the fuel
combusted. For example, typical units for an F-factor are dry standard cubic
feet of stack gas per million Btu heat input (dscf/mmBtu), or standard cubic
feet of CO2 per million Btu (scf CO2 /mmBtu). The
F-factors, which are listed in Appendix F of the rule, are derived for each
type of fuel based on the thermodynamic principles of combustion. Since
F-factors are derived assuming that fuel and air are mixed in an exact
stoichiometric ratio and that combustion is complete, corrections for excess
air are needed.
Determining
mass emission rates
To obtain emission rates
in terms of mass per unit time (lb/hr, tons/hr, or oz/hr), the emission rate
(lb/scf, tons/scf, or oz/scf) is multiplied by the stack gas flow rate, in
standard cubic feet per hour (scfh). For NOx, the mass emission
rate in lb/hr may also be calculated by multiplying the NOx emission rate (lb/mmBtu) by the heat input rate (mmBtu/hr).
Determining
heat input rate, in mmBtu/hr
To determine heat
input rate (mmBtu/hr), the monitored stack gas flow rate (scfh) is divided by the
F-factor (scf/mmBtu) and a correction for excess air is applied.
Converting mass
emission rates and heat input rates
To convert an hourly
pollutant mass emission rate (e.g., lb/hr) to mass (e.g., lb), or to convert an
hourly heat input rate (mmBtu/hr) to heat input (mmBtu), multiply the emission
(or heat input) rate by the operating time. The operating time, top, is defined as the fraction of the hour in which the unit combusts
fuel. For units sharing a common stack, if the CEMS are installed on the stack,
the operating time is the fraction of the hour that exhaust gases flow through
the stack. For example, top
= 1.00 for a full hour of unit
operation, 0.50 for a half-hour of unit operation, etc.
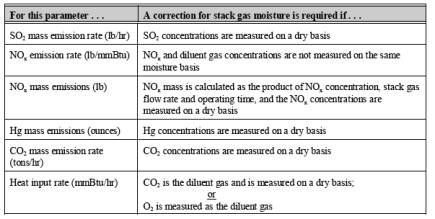
3.6 When are
corrections for stack gas moisture content required?
Determination of the
stack gas moisture content is required only in certain situations where CEMS
are used to satisfy the Part 75 monitoring requirements. Table 7 summarizes
when correction for the stack gas moisture content is required. Generally
speaking, the stack gas moisture content must be monitored when two parameters
in the emission or heat input rate equation (e.g., gas concentration and stack
gas flow rate) are not measured on the same moisture basis (i.e., one is
measured on a wet basis and the other on a dry basis).
For example, flow
rate monitors always measure stack gas flow on a wet basis. This means that the
volume of gas measured includes the contribution from the moisture content of
the stack gas. Therefore, when a gaseous pollutant such as SO2 is measured on a dry basis, in order to obtain the correct mass emission
rate in lb/hr, the dry-basis SO2 concentration is multiplied by
the wet-basis stack gas flow rate, and a moisture correction is applied. As a
second example, when NOx
emisssion rate in lb/mmBtu is measured,
a moisture correction is needed if the NOx concentration and
diluent gas monitors measure on different moisture bases.
If a correction for
the stack gas moisture content is required, one of the following moisture measurement
methods must be used:
•
An O2 analyzer (or analyzers) capable of measuring on both a wet and dry
basis.
•
A continuous moisture
sensor.
•
A stack temperature
sensor and a moisture look-up table (for saturated gas streams only).
•
A fuel-specific default
moisture value defined in Part 75 (for coal and wood, only).
•
A site-specific default
moisture value approved by petition under §75.66.
Table
7: Correction for Stack Gas Moisture Content
3.7 What if a unit has multiple
stacks or shares a stack with other units?
If a unit shares a
common stack with other units or emits through multiple stacks, Part 75
requires procedures to be implemented that ensure complete emissions and heat
input accounting. In some cases, the procedures will require monitoring systems
to be installed at more than one stack or duct location. The configuration of
ductwork and stacks, the program(s) that the unit is subject to, and the
regulatory status of the units (i.e., affected or non-affected) determine the
number of monitors needed and the required locations.
Common and multiple
stack configurations for the various trading programs are addressed in several
different places within Part 75. For Acid Rain Program units, the rule
provisions pertaining to common and multiple stacks are found in §§ 75.16
through 75.18. For CAIR SO2
Trading Program units, the provisions
are in §75.16. For NOx Budget Trading Program units and CAIR NOx Trading Program units, the applicable provisions are in §75.72. For Hg
Budget units under CAMR, the common and multiple stack provisions are found in
§75.82.
These rule provisions
are summarized in Table II-A of Appendix II of this guide. For configurations
that are not covered in Table II-A, sources should contact EPA for additional
guidance.
3.8 What are the
missing data procedures for CEMS?
For each unit
operating hour in which quality-assured CEMS data are not obtained (i.e., are
missing), Part 75 requires substitute data to be reported. The rather complex
CEMS missing data procedures are discussed in detail in Section 9 of this
guide.
4.0
APPENDIX D METHODOLOGY FOR GAS-FIRED AND OIL-FIRED UNITS
If an affected unit meets
the definition of gas-fired or oil-fired, the alternative methodology in
Appendix D of Part 75 may be used instead of CEMS, for certain parameters.
Appendix D applies only to the measurement of the SO2 mass emission rate and the unit heat input rate.
The alternative methodology in
Appendix D of Part 75 for gas-fired and oil-fired units pertains
to the monitoring of the SO2 mass
emission rate and the unit heat input rate.
4.1 What is a gas-fired
or oil-fired unit?
Gas-fired and oil-fired
units are defined17 in Tables 8 and 9.
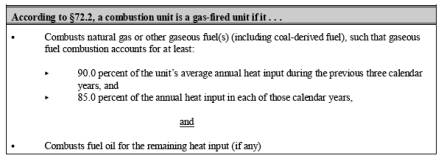
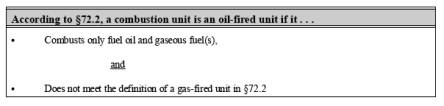
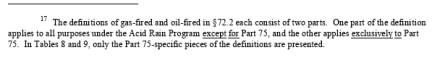
____________________
4.2 What is the
Appendix D alternative monitoring
method?
The alternative
monitoring methodology in Appendix D requires continuous monitoring of the fuel
flow rate and periodic sampling of the fuel characteristics, such as sulfur content,
gross calorific value (GCV), and density. The measured fuel flow rates are used
together with the results of the fuel sampling and analysis to determine the SO2 mass emission rate and/or the unit heat input rate, depending on the
requirements of the applicable program(s). The Appendix D methodology is
summarized in Table 10.
Table
10: Appendix D Monitoring Methodology
for
Gas-Fired and Oil-Fired Units
4.3 How is the fuel
flow rate measured?
Appendix D requires the
fuel flow rate to be continuously monitored and the data to be reduced to
hourly averages. To achieve this a certified fuel flowmeter or a commercial
billing meter may be used. To certify a fuel flowmeter, its accuracy must be
established using one of the methods18 specified in
section 2.1.5.1 of Appendix D.
•
In most cases, the
certification test procedure consists of calibrating the meter with a flowing
fluid, at three flow rates covering its normal operating range. Generally, this requirement is met by calibrating the
flowmeter in a laboratory, although the flowmeter may be calibrated at the
affected facility, by comparison against an in-line “master meter” which has
been tested for accuracy within the past 365 days using one of the methods in
section 2.1.5.1 of Appendix D.
•
Alternatively, an
orifice-, nozzle- or venturi-type flowmeter may be certified if its primary
element (for example, the orifice plate) meets the design criteria specified in
American Gas Association Report No. 3, and if its pressure, temperature, and
differential pressure transmitters are calibrated with standards traceable to
the National Institute of Standards and Technology (NIST).
•
A commercial billing
meter may be used for Appendix D applications without certification, if the meter
can provide hourly average fuel flow rates, and if the regulated source is not
affiliated with the billing company.
![]()
____________________
4.4 What are the fuel
sampling requirements of Appendix D ?
For both gaseous fuels
and fuel oil, Appendix D requires periodic sampling of fuel characteristics
(sulfur content and/or GCV and/or density). The required samples may be taken
either by the owner/operator, the fuel supplier, or by an independent
laboratory.
Appendix D divides
gaseous fuels into three categories: (1) pipeline natural gas (PNG); (2)
natural gas; and (3) other gaseous fuels. The distinction between PNG and
natural gas is in the fuel sulfur content. Natural gas may have as much as 20
grains of total sulfur per 100 standard cubic feet (i.e., 20 gr/100 scf), but
to qualify as PNG, the total sulfur content of the gas must not exceed 0.5
gr/100 scf. The Appendix D fuel sampling and analysis requirements for gaseous
fuels are as follows:
•
For PNG and natural
gas, annual sampling of the total sulfur content19 is required,
unless a valid fuel contract is in place documenting that the fuel meets the
definition of PNG or natural gas. If such a contract exists, the owner or
operator may choose not to perform the annual sampling—however, the maximum
total sulfur content specified in the contract (often 20 gr/100 scf) must then
be used to calculate the SO2 emissions.
•
The GCV of PNG or
natural gas must be determined monthly, with certain exceptions for units that
operate infrequently.
•
For other gaseous fuels
transmitted by pipeline, the required frequency of total sulfur sampling19 is hourly, unless the results of a 720-hour demonstration20 show that the fuel qualifies for less frequent (i.e., daily or annual)
sampling.
•
The GCV of other
gaseous fuels transmitted by pipeline must be determined daily, or hourly
unless the fuel is demonstrated 20 to have a low GCV variability,
in which case monthly sampling is sufficient.
•
For other gaseous fuels
delivered in shipments or lots, each shipment or lot must be sampled for sulfur
content19 and GCV.
Acceptable ASTM and
GPA sampling and analysis methods for gaseous fuels are referenced in sections
2.3.3.1.2 (for fuel sulfur content) and 2.3.4 (for fuel GCV) of Appendix D.
For oil, Appendix D
provides several fuel sampling and analysis options. The required sampling of
the sulfur content19, GCV and, if applicable, density of the oil may be
done using any of the following methods:
•
Daily sampling; or
•
Composite sampling for
up to 168 hours, using hourly flow-proportional sampling or continuous drip
sampling; or
•
Sampling after each
addition of oil to the storage tank; or
•
Sampling each delivery
or “lot” of fuel (i.e., each ship load, barge load, group of trucks, etc). The
sample may be taken from either the supplier’s storage tank or from the
shipment tank (container) upon receipt.
Acceptable ASTM
sampling and analysis methods for fuel oil are given in sections 2.2.5 (for
fuel sulfur content) and 2.2.7 (for fuel GCV) of Appendix D.
![]()
![]()
________________
4.5 How is the SO2 mass emission rate calculated?
For an Acid Rain
Program unit using the Appendix D methodology, the hourly SO2 mass emission rate is calculated using an equation that has one of the
following basic structures:
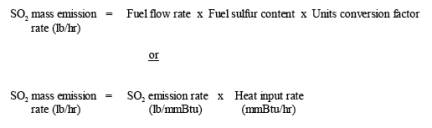
An example of an
equation with the first basic structure is Equation D-2 in section 3 of
Appendix D, and an equation with the second basic structure is Equation D-5. In
the first general equation above, the fuel flow rate is the hourly average
reading from the fuel flowmeter, and the fuel sulfur content is based on the
results of periodic fuel sampling and analysis (see Section 4.7, below). In the
second general equation, the heat input rate is derived from the hourly average
fuel flowmeter reading and the fuel GCV (see Section 4.6, below), and the SO2 emission rate is either:
•
A generic default value
for the type of fuel combusted (e.g., 0.0006 lb/mmBtu for PNG); or
•
A site-specific default
value, determined by substituting the GCV and total sulfur content of the fuel
into Equation D-1h in Appendix D.
Note that for oil,
when the fuel flow rate is measured on a volumetric basis (e.g., gal/hr), it must
be converted to a mass basis using the oil density. Therefore, for Acid Rain
sources using volumetric oil flowmeters, periodic sampling of the density of
the oil is also required.
4.6 How is the unit
heat input rate calculated?
For an Acid Rain, NOx Budget, or CAIR unit using Appendix D to determine the hourly unit heat
input rate, an equation with the following basic structure is used:
Heat input rate =
Fuel flow rate x Fuel GCV x Units conversion factor
(mmBtu/hr)
Examples of equations
having this basic structure are Equations D-6 and D-8 in section 3 of Appendix
D. In the general equation above, the fuel flow rate is the hourly average
reading from the fuel flowmeter, and the GCV is based on the results of
periodic fuel sampling and analysis. The units of measure for the fuel flow
rate and the GCV must be consistent. For example, if the fuel flowmeter
measures in gallons per hour, the GCV is expressed in units of Btu per gallon.
4.7 Which sulfur
content, GCV, and density values are used in the calculations?
Appendix D provides
the source owner or operator with considerable flexibility in selecting the
values of fuel sulfur content, GCV and density that are used in the emission
and heat input calculations. Generally speaking, the values used in the
calculations are determined in one of two ways:
(1) The results
of the fuel sampling and analysis are used directly in the calculations.
Example 1: The GCV from the most recent monthly sample of
pipeline natural gas is used in the heat input rate calculations.
Example 2: For a process gas, hourly samples are taken of the
sulfur content and GCV, and the hourly values are used to calculate the SO2
emissions and unit
heat input rate; or
(2) An “assumed
value” is used in the calculations. The assumed value may be:
•
A default SO2 emission rate of 0.0006 lb/mmBtu, for a fuel that qualifies as pipeline
natural gas; or
•
The highest value from
any required sample taken in the previous calendar year; or
•
The highest value from
any sample taken in a specified “look-back” period; or
•
The highest value
specified in a valid, active fuel contract or tariff sheet; or
•
The value obtained from
a 720-hour characterization of the fuel’s sulfur content or GCV21
This calculation
method is subject to the following conditions:
•
If the results of any
required fuel sampling and analysis exceed the assumed value, then that sample
result becomes the new assumed value; and
•
If the assumed value is
from a fuel contract or tariff sheet, and if the contract or tariff sheet is
superseded by a new one, then the assumed value may have to be adjusted, or, in
some instances, the fuel may have to be reclassified. Consider the following
examples:
Example 1: A maximum GCV
of 105,000 Btu/100 scf is specified in a valid, active natural gas contract.
This GCV value may continue to be used in the heat input rate calculations,
provided that it is not exceeded, either by the results of a required monthly
GCV sample, or by the maximum GCV value in a new contract.
Example 2: In 2004, the
highest percent sulfur (%S) value obtained from the required samples of
distillate oil was 0.15 %S, by weight. This %S value may be used in the SO2 emission calculations throughout 2005, provided that it is not exceeded
by the results of any required fuel sample.
Example 3: Daily manual
sampling of fuel oil is performed, and on each successive unit operating day,
the highest sulfur content, GCV, and density values from the previous 30 daily
samples are used in the calculations.
Example 4: The results of
a 720-hour demonstration under section 2.3.6 of Appendix D show that a process
gas has a low sulfur variability. A default SO2 emission rate
of 0.025 lb/mmBtu is calculated by substituting the 90th percentile value of the fuel’s sulfur content from the demonstration
into Equation D-1h. This default emission rate may continue to be used unless
it is exceeded when Equation D-1h is applied to the results of a required
annual sample of the fuel’s sulfur content.
Example 5: A fuel
initially qualifies as pipeline natural gas, based on historical fuel sampling
data. In this year’s required annual fuel sampling and analysis, 3 samples are
taken and the total sulfur content of all samples is between 1.0 and 1.5 gr/
100 scf. The fuel is therefore re-classified as “natural gas” and the average
total sulfur value from the 3 samples is used in Equation D-1h, to calculate a
site-specific default SO2
emission rate.
For a complete listing of all of the available calculation options for fuel oil and gaseous fuels, see Tables D-4 and D-5 in Appendix D. Also note that for each of these options, instructions are given in section 2.3.7 of Appendix D, explaining when and how to apply the fuel sampling results. This helps to ensure national consistency in the reporting of Appendix D data.
![]()
_________________
4.8 What are the
on-going quality-assurance requirements of Appendix D?
Following initial
certification, each Appendix D fuel flowmeter (except for qualifying fuel
billing meters) must undergo periodic accuracy testing, using the same general
approach that was used for initial certification (see Section 4.3, above). Fuel
flowmeter accuracy testing must be performed once every 4 calendar quarters,
unless the flowmeter qualifies for an extension of the test deadline. A
one-quarter extension of the test deadline may be claimed for any calendar
quarter in which:
•
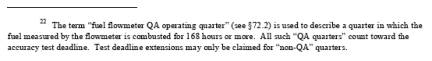
The fuel measured by
the flowmeter is burned for less than 168 hours22 . This type
of extension is most advantageous for fuels that are seldom combusted and for
units that operate infrequently; or
•
The optional fuel
flow-to-load ratio test described in section 2.1.7 of Appendix D is performed
and passed. This option is most useful for fuels that are routinely combusted
for more than 168 hours per quarter.
Note that fuel
flowmeter accuracy test deadlines may not be extended indefinitely. The limits
to these extensions are as follows:
•
If the deadline extension
is based on infrequent combustion of a fuel or infrequent unit operation, a
flowmeter accuracy test must be performed no later than 4 “QA” quarters22 or 20 calendar quarters—whichever comes first—after the quarter in which
the previous test was done; or
•
If the deadline is
being extended by performing the fuel flow-to-load ratio test, the maximum
allowable extension is 20 calendar quarters from the quarter of the previous
test.
___________________
In addition to
performing periodic fuel flowmeter accuracy testing, section 1.3 in Appendix B
of Part 75 requires the owner or operator of an Appendix D unit to develop and
implement a quality-assurance plan. The essential elements of the QA plan
include the following:
•
A written record of the
fuel flowmeter accuracy test procedures;
•
Records of maintenance,
adjustments, and repairs of the fuel flowmeter(s); and
•
A written record of the
standard procedures used to perform the required fuel sampling and analysis.
4.9 What are the
missing data procedures for an Appendix D unit?
Whenever fuel flow
rate data or any of the required fuel sampling data is missing, Appendix D
requires substitute data values to be reported. The Appendix D missing data
procedures are discussed in detail in Section 9 of this guide.
5.0
APPENDIX E METHODOLOGY FOR GAS-FIRED AND OIL-FIRED PEAKING UNITS
If a unit is in the
Acid Rain Program, NOx Budget Program, or CAIR NOx Trading Program(s), and it meets the definition of a “peaking unit” in §72.2,
and if it also qualifies as oil-fired or gas-fired (see Section 4.1, above),
then the alternative methodology in Appendix E of Part 75 may be used to
monitor the NOx emission rate, in lieu of installing CEMS. For a
qualifying Appendix E unit:
•
The Appendix D
methodology must be used to measure the hourly unit heat input rate (see
Section 4.6, above); and
•
Emission testing must
be conducted at four different loads to develop a correlation curve of NOx emission rate versus heat input rate
The Appendix E methodology for
gas-fired and oil-fired peaking units pertains only to the monitoring of NOx
emission rate. To use this methodology, a correlation curve of NOx emission
rate vs heat input rate is first derived from emission testing, Then, the hourly
unit heat input rate is measured using the Appendix D methodology, and the
hourly NOx emission rate is determined from the correlation curve.
The definition of a
peaking unit is presented in Table 11. Table 11 shows that for a unit that
reports emissions data year-round, peaking unit qualification depends on the
annual capacity factor23
of the unit. For units in the NOx Budget Program and units in the CAIR Ozone Season Trading Program that
report emissions only for the ozone season months (May through September),
peaking unit qualification depends on the ozone season capacity factor24 of the unit.
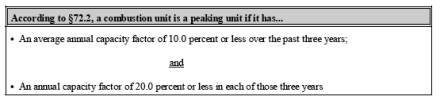
____________________
5.2 How is an Appendix
E correlation curve constructed?
Appendix E correlation
curves are derived from emission test results. Appendix E requires an initial
four-load NOx emission rate test to be performed for each type of
fuel combusted in the unit, except for emergency fuel, for which the testing is
optional. For boilers, the testing is performed using EPA Reference Methods 7E
and 3A, and for combustion turbines and diesel or dual-fuel reciprocating
engines, Reference Method 20 is used25. The emission
testing is done at four evenly-spaced load points, ranging from the minimum to
the maximum unit operating load, and three test runs are performed at each load
level. For existing units, two years of historical data are used to establish
the minimum and maximum operating loads. For new units, five-year projections
of the minimum and maximum loads are used.
During each Appendix
E test run, the unit heat input rate is determined using the fuel GCV and
readings from a fuel flowmeter that meets the requirements of Part 75, Appendix
D. Also, certain parameters must be monitored during each test run. For
boilers, excess oxygen is monitored, and it must either be set at a normal
level or at a conservatively high level. For turbines and diesel or dual-fuel
reciprocating engines, at least four parameters indicative of the unit’s NOx formation characteristics are monitored and acceptable ranges for each
parameter are established during testing. If a turbine uses water injection to
control NOx emissions, the water-to-fuel ratio must be one of the
monitored parameters.
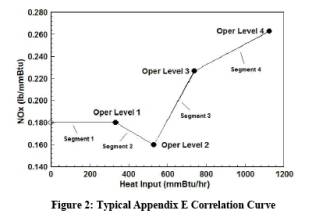
The NOx emission rate and heat input rate data are averaged at each load level.
Then, a correlation curve of NOx emission rate (lb/mmBtu) versus
heat input rate (mmBtu/hr) is constructed and the curve segments are programmed
into the data acquisition and handling system (DAHS). A typical Appendix E
correlation curve is shown in Figure 2, above.
![]()
____________________
5.3 How are the hourly
NOx emissions determined?
The Appendix E
methodology is summarized in Table 12. The hourly NOx emission rate is determined by measuring the hourly heat input rate26 and reading the corresponding NOx value from the
Appendix E correlation curve27. To calculate the hourly NOx mass emissions, the unit operating time28 must also be
known.
Table
12: Appendix E Methodology for Determining NOx Emissions
from
Oil-and Gas-Fired Peaking Units
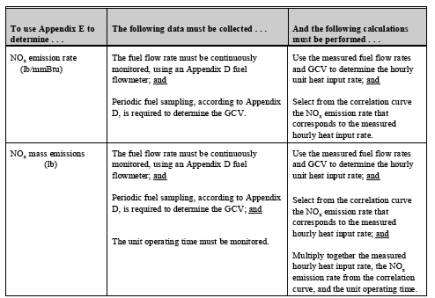
If different fuels
are co-fired in an Appendix E unit, there are two possible ways of determining
the hourly NOx emission rate:
•
Calculate the heat input
rate for each type of fuel combusted during the hour, using the fuel flow rate
and the GCV. Then, determine a NOx emission rate for
each fuel from its correlation curve and use Equation E-2 in Appendix E to
calculate a Btu-weighted hourly NOx emission rate for
the unit; or
•
If a consistent fuel
mixture is always combusted in the unit (i.e., if the composition of the
mixture does not vary by more than ±10%), a single correlation curve for the
mixture may be derived, rather than developing separate curves for the
individual fuels. If a unit qualifies to use this option, the hourly heat input
rate will be a composite value29, derived from the individual
fuel flow rates, the GCV values, the fuel usage times30, and the unit operating time28.
5.4 What are the fuel
sampling requirements of Appendix E?
Appendix E requires
the owner or operator of an affected unit to use the fuel sampling and analysis
procedures of Appendix D, to determine the GCV of each type of fuel combusted
in the unit. Therefore, the GCV sampling options and analytical methods
described in section 4.4 of this guide, apply to Appendix E units.
__________________
5.5 What are the
on-going quality-assurance requirements of Appendix E?
The on-going quality-assurance
requirements for Appendix E units are as follows:
• Parameter
Monitoring.Once the initial correlation curve has been
developed, Appendix E requires hourly monitoring of the parameters that were
monitored during the baseline emission testing (i.e., excess O2 for boilers and the four parameters associated with NOx formation for turbines and diesel or dual-fuel reciprocating engines).
If, for any boiler
operating hour, the excess O2 data is missing or invalid, or
if the excess O2 level is greater than 2% O2 higher than the value observed during the baseline emission testing at
the same heat input rate, then substitute NOx emission rate data
must be reported for that hour. Similarly, for turbines, diesel and dual fuel
reciprocating engines, for any hour in which some or all of the required
parametric data is missing, invalid or outside the acceptable ranges
established during the baseline emission testing, missing data substitution
must be used for NOx emission rate.
•
Periodic
Re-testing. Appendix E requires
periodic re-testing of each affected unit once every 5 years (20 calendar
quarters), to determine new correlation curves. Unscheduled re-testing is also
required if:
Ø For boilers, the excess O2 level at a particular heat input rate is more than 2% O2 greater than the value observed during the baseline emission testing,
for more than 16 consecutive unit operating hours; or
Ø For combustion turbines and for diesel or dual-fuel
reciprocating engines, some or all of the required parametric data is outside
the acceptable ranges established during the baseline emission testing for more
than consecutive unit operating hours.
•
QA Plan. The
owner or operator of an Appendix E unit is required to develop and implement a
quality-assurance (QA) plan for the unit. The contents of the plan are
specified in section 1.3.6 of Part 75, Appendix B and section 4 of Appendix E.
At a minimum, the QA plan must include:
Ø The data and results from the initial and most recent
NOx emission rate testing, including the parametric data;
Ø A written record of the procedures used to perform
the NOx emission rate testing;
Ø The quality-assurance parameters that are monitored
and the acceptable values and ranges of those parameters;
Ø Records of the monitored parametric data for each
unit operating hour; and
Ø Because Appendix E requires an Appendix D fuel
flowmeter to be used to monitor the hourly unit heat input rate, the flowmeter
must meet the ongoing QA requirements of Appendix D. Therefore, the the QA plan
must also include the elements described in Section 4.8 of this guide.
5.6 What are the
missing data procedures for an Appendix E unit?
The owner or operator
of an Appendix E unit is required to implement the missing data procedures of
both Appendix D (for fuel flow rate and GCV) and Appendix E (for NOx emission rate). These procedures are discussed in detail in Section 9 of
this guide.
5.7 What happens if an
Appendix E unit loses its peaking unit status?
If, at the end of any
calendar year or ozone season, the capacity factor requirements in Table 11,
above, have not been met for an Appendix E unit, its peaking unit status is
lost at that point. When this happens, Part 75 requires a NOx-diluent monitoring system to be installed and certified by December 31
of the calendar year following the year in which the peaking status is lost.
For example, if, at the end of 2004, the 3-year average annual capacity factor
of an Appendix E unit for 2002, 2003 and 2004 is determined to be 12.5%, then a
NOx-diluent CEMS must be installed and certified by
December 31, 2005 31.
A unit which has
previously qualified as a peaking unit but loses that status may qualify again
as a peaking unit in a subsequent year or ozone season, but only if capacity
factor data for a three year period following the loss of peaking status show
that the unit once again meets the criteria in Table 11, above.
____________________
6.0
LOW MASS EMISSIONS METHODOLOGIES
6.1 Gas-Fired and
Oil-Fired Units
Part 75 provides an
alternative monitoring methodology (§75.19) that may be used instead of CEMS,
for gas- and oil-fired units that have very low mass emissions. This low mass
emissions, or “LME” methodology does not require actual continuous monitoring
of emissions or unit heat input. Rather, hourly SO2 , NOx and CO2 emissions are estimated using
fuel-specific default emission rates (“emission factors”), and hourly heat
input is either estimated from records of fuel usage, or it is reported as the
maximum rated heat input for each unit operating hour. Once the LME methodology
has been selected, it must be used for all program parameters.
“Mixing-and-matching” LME with other Part 75 methodologies is not allowed.
Therefore, the LME methodology must be used for SO2 , NOx , CO2 and heat input if the unit is
in the Acid Rain Program, for SO2 and heat input if the unit is
in the CAIR SO2 Trading Program, and for NOx and heat input if the unit is in the NOx Budget
Program or if it is in the CAIR NOx Trading Program(s).
The low mass emissions (LME)
methodology in §75.19 provides an alternative to CEMS for determining SO2, NOx,
and CO2 emissions and unit heat input. To qualify to use the LME methodology, a
unit must be gas-fired or oil-fired, and its SO2 and/or NOx mass emissions must
not exceed certain annual and/or ozone season limits.
6.1.1 What is a low
mass emissions (LME) unit?
Low mass emission units
are defined in Table 13.
Table
13. Low Mass Emissions Units
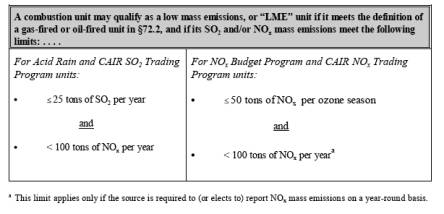
6.1.2 How does a unit
qualify for LME status?
To use the LME
methodology for a particular gas-fired or oil-fired unit, a certification
application must be submitted to EPA and to the appropriate State or local
agency, at least days prior to the date on which the methodology will first be
used. The essential elements of the certification application, which has both
electronic and hard copy portions32, are as follows:
•
The application must
include a complete monitoring plan for the unit33; and
•
For sources that report
emissions data on a year-round basis, the application must demonstrate that in
each of the three calendar years immediately preceding the year of the
application, the SO2 and/or NOx mass emissions from
the unit did not exceed the annual threshold limits shown in Table 13 above.
And if the unit is in the NOx Budget Program or in the CAIR
Ozone Season Trading Program, it must be demonstrated that in each of the
previous three ozone seasons, the NOx mass emissions did
not exceed 50 tons.
To make the required demonstration(s):
Ø Emissions data from historical Part 75 electronic
data reports (EDRs) must be used, where these reports are available, except as
noted immediately below; or
Ø In the absence of historical EDRs, reliable estimates
of the unit’s emissions for the previous 3 years (or ozone seasons) must be
provided. These estimates may be based on records of unit operation, fuel
usage, representative emission test data, CEM data, fuel sampling data, etc.
Conservative default values may also be used in the calculations (e.g., the
“generic” emission rates from Tables LM-1 through LM-3 in §75.19, the unit’s
maximum rated heat input, etc.)34; or
Ø For units with less than 3 years (or ozone seasons)
of operating history, projected emissions estimates for one or more years may be
used, to make up the difference. Projections may also be used if emission
controls have been recently installed and the emissions data for one or more of
the past 3 years or ozone seasons is not representative of present emission
levels. All projections should be based on the anticipated manner of unit
operation, the type(s) of fuel(s) that will be burned, and the expected
emission rates; or
Ø If a unit cannot qualify for LME status based on its
historical emissions and is not eligible to use projected emissions estimates,
it is still possible to use the LME methodology if an enforceable permit
restriction is accepted, limiting the number of unit operating hours per year
(or ozone season), so that the LME emission thresholds will not be exceeded;
and
___________________
•
The certification
application must also specify the projected date on which the LME methodology
will first be used. Note that this projected date may not be arbitrarily
selected, because §75.19 requires the LME methodology to be used for all unit
operating hours in a calendar year or ozone season. Therefore, the only
acceptable start dates for using the LME methodology are these:
Ø For an existing unit that reports emissions data on a
year-round basis, the first unit operating hour in a calendar year.
Ø For an existing unit that reports on an ozone
season-only basis, the first unit operating hour in an ozone season.
Ø For new Acid Rain Program units, and for new units in
the CAIR SO2 and NOx Trading Programs, at the hour
of commencement of commercial operation (as defined in §72.2).
Ø For new units in the NOx Budget
Program, at the first hour of unit operation (“first-fire”); and
•
Finally, the
certification application must describe the calculation methodology that will
be used to ensure that the unit maintains its LME status. That is:
Ø For each emissions parameter (i.e., SO2 , CO2 , and/or NOx), the application
must indicate whether the generic default emission rates in Tables LM-1 through
LM-3 will be used in the calculations, or whether site-specific default values,
determined by emission testing or other acceptable means, will be used; and
Ø For heat input, the application must indicate whether
the maximum rated unit heat input will be reported for every operating hour or
whether the long-term fuel flow methodology, based on records of fuel usage,
will be used.
These calculation
methods are discussed in greater detail in Section 6.3, below.
Once a complete
certification application has been received by EPA and the State, the LME
methodology is assigned a provisionally certified status, pending the results
of Agency review. The regulatory agencies have a period of 120 days from the
receipt of a complete application to review the application and to issue a
notice of approval or disapproval to the source. If no such notice is provided
by day 120, then the methodology is considered to be “certified by default”.
However, note that the LME methodology may not be used prior to the start date
indicated in the certification application, even if a notice of approval is
issued or if the methodology is certified by default prior to that date.
6.1.3 How are emissions
and heat input calculated for an LME unit?
To calculate the hourly SO2 , NOx and CO2 mass emissions in lb (or tons)35, default emission rates, expressed in units of lb/mmBtu (or ton/mmBtu)35, are used together with an estimate of the unit heat input (mmBtu).
Generic vs.
Site-Specific Default Emission Rates
For the combustion of
fuel oil and natural gas, the generic default emission rates in Tables LM-1 and
LM-3 must be used to estimate SO2 and CO2 emissions, unless a petition to use alternative emission rates has been
approved under §75.66. However, for NOx, use of the generic
default emission rates in Table LM-2 is optional. In lieu of using these
generic values, emission testing may be performed to determine site-specific NOx emission rates.
If the unit combusts
a gaseous fuel other than natural gas, site-specific default emission rates
must be determined in the following way for all program parameters, since there
are no generic values in §75.19 for such fuels:
•
For SO2, the sulfur content of the fuel is quantified by performing the
720-hour demonstration described in Part 75, Appendix D, section 2.3.6, to
determine whether the unit is eligible to use a default SO2 emission rate for reporting purposes. If the unit is not eligible, then
the LME methodology may not be used. But if the unit is eligible, the
appropriate value of the fuel’s total sulfur content (from the demonstration)
is substituted into Equation D-1h in Appendix D, to determine the default SO2 emission rate in units of lb/mmBtu.
•
For NOx, fuel-and unit-specific emission testing is performed to determine the
default emission rate(s), in units of lb/mmBtu.
•
For CO2, fuel sampling and analysis is performed to determine a carbon-based
Ffactor for the gas. Then, Equation G-4 in Appendix G of Part 75 is solved for
the ratio of (WCO2/H), to obtain the CO2 emission
factor in units of tons/mmBtu.
![]()
____________________
To determine the
hourly heat input for an LME unit, there are two options:
•
The maximum rated unit
heat input may be reported for each unit operating hour; or
•
Long-term fuel flow may
be used. The long-term fuel flow methodology requires a reliable estimate of
the amount of each type of fuel combusted in the unit during each quarter36. Data from certified Appendix D fuel flowmeters or gas billing records may
be used to make these estimates. Alternatively, for fuel oil, one of several
acceptable API “tank drop” measurement methods may be used. The total unit heat
input for the quarter is calculated from the estimated quarterly fuel usage and
the fuel GCV37. The total heat input is then apportioned to the
individual unit operating hours, on the basis of unit load.
To determine the
hourly SO2 , NOx, and CO2 mass emissions, an equation that has the following basic structure is
used:
![]()
In the general equation
above, the term “hourly heat input” either represents the product of the
maximum rated hourly unit heat input (mmBtu/hr) and the unit operating time38 (hr), or is an apportioned value from the long-term fuel flow
methodology.
___________________
The heat input
apportionment equations for long-term fuel flow have the general form:
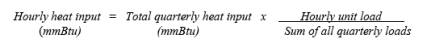
In this general equation,
the unit loads are expressed on a consistent basis, either in megawatts or
thousands of pounds (klb) of steam per hour.
The quarterly SO2 , NOx, and CO2 mass emissions are
calculated by summing the hourly mass emissions and converting this sum to tons
as necessary (i.e., for SO2
and NOx). The
cumulative annual (or ozone season) tons of SO2 , NOx, and CO2 are calculated by summing the appropriate quarterly
values. The cumulative SO2
and/or NOx values are
then compared against the LME emission threshold values in Table 13, above, to
determine whether the unit has retained its LME status.
6.1.4 How are
site-specific default NOx emission rates
determined for an LME unit?
There are three basic
sources of information that may be used to determine the site-specific NOx emission rate(s) for a LME unit. These are:
•
Emission testing;
•
Historical CEMS data;
and
•
Previous Appendix E test
results
As explained in
Section 6.1.3 above, emission testing may (and for gaseous fuels other than
natural gas, must) be performed to establish fuel- and unit-specific default NOx emission rates for a LME unit. Testing at four load levels is required
(with some exceptions---see below), with three runs at each load. The basic
procedures described in Part 75, Appendix E, section 2.1 are used for the
testing, except that unit heat input is not measured during the test runs.
Periodic retesting is required, once every five years (20 calendar quarters).
EPA Reference Methods
7E and 3A are used to test boilers and Method 20 is used for combustion
turbines39, except that the NOx concentrations
are not corrected to 15% O2. In addition, for units equipped with add-on NOx emission controls (e.g., water injection, SCR, etc.) and for combustion
turbines that use lean premix (dry low-NOx) technology to
reduce NOx emissions, appropriate parameters must be monitored
and recorded during the test period, to document that the emission controls are
working properly. From this data, acceptable values and/or ranges for each
parameter are established and kept in a quality-assurance plan for the unit.
![]()
________________
For a group of
“identical” LME units, a subset of the units may be tested, rather than testing
each unit individually. To be considered identical, all of the units in the
group must:
•
Be of the same size
(maximum rated hourly heat input); and
•
Have the same history of
modifications (e.g., control device installations, frequency of major
maintenance outages, etc.); and
•
Have stack or turbine
outlet temperatures within ±50 B F of the average stack or
turbine outlet temperature for the group.
If the group of LME units
qualifies as identical, Table LM-4 in §75.19 is used to determine how many
units need to be tested (e.g., if there are 3 to 6 units in the group, at least
2 units must be tested).
In the following
instances, the initial NOx
emission rate testing (or periodic
retesting) for LME units may be done at fewer than four loads
•
Testing may be done at
a single load if the unit has operated at a single load level for at least 85%
of the operating hours in the past 3 years or ozone seasons; or
•
Testing may be conducted
at two or three load levels if those load levels cumulatively represent at
least 85% of the operating hours in the past 3 years or ozone seasons; or
•
For combustion turbines
that operate principally at base-load (or at a set-point temperature), but are
capable of operating at a higher peak load level (or at a higher internal
operating temperature), testing may be done only at base-load, provided that a
suitable upward adjustment is made to the base-load NOx emission rate when the unit operates at peak load40; or
•
If the initial testing
was performed at multiple load levels, the required retests may be done at
single load, i.e., at the load level for which the highest NOx emission rate was obtained in the initial test.
![]()
_____________________
If a unit has at
least three years (or ozone seasons) of quality-assured historical NOx emission rate data from a NOx-diluent CEMS, the
CEMS data may be used to determine fuel- and unit-specific default NOx emission rates. In order to do this, at least 168 hours of
quality-assured data are required for each fuel type, representing the full
range of normal unit operating conditions.
For a peaking unit switching
from the Appendix E methodology (see Section 5 of this guide) to LME, the
results of a previous four-load Appendix E NOx emission test
may be used to determine the site-specific default NOx emission rates, provided that the test results are less than 5 years
old.
6.1.5 Which
site-specific default NOx emission rates are
used for reporting ?
Once the necessary
emission test data or CEMS data for each type of fuel combusted in the unit
have been obtained, as described in Section 6.1.4, above, the site-specific
default NOx emission rate(s) that will be used for Part 75
reporting are determined as follows:
•
If the NOx emission rate is based on emission test results:
Ø Report the highest NOx emission rate
obtained at any tested load level (average of three runs), except for units
that use SCR or SNCR41, and as otherwise noted below.
Ø If the unit is an uncontrolled diffusion flame
turbine, report the highest 3-run average NOx emission rate
obtained at any tested load, corrected to the average annual ambient conditions
of temperature, pressure and relative humidity at the test site, using Equation
LM-1a in §75.19.
Ø For units equipped with SCR or SNCR:
If the testing was
done downstream of the SCR or SNCR, while these emission controls were in
operation, report the higher of:
•
The highest 3-run
average NOx emission rate obtained at any tested load level; or
•
0.15 lb/mmBtu
If the testing was
performed upstream of the SNCR or SNCR (or with the these controls out-of-service), and if the unit also uses water or steam injection
or dry low-NOx (DLN) technology to reduce NOx emissions, and if the water injection, steam injection, or DLN
technology was in-service during
the testing, report the highest 3-run average emission rate at any tested load
level as the default NOx
emission rate.
Ø For a turbine that operates only at base load and
peak load (or at two distinct set-point temperatures), report the 3-run average
NOx emission rate from the base load testing when the
unit operates at base load, and report the 3-run average from the peak load
testing when the unit operates at peak load. If testing was done only at base
load, use a NOx emission rate of 1.15 times the base load emission
rate during peak load operation.
Ø For units that use add-on (post-combustion) NOx controls of any kind and for units that use dry low-NOx technology, report the appropriate generic default NOx emission rate from Table LM-2 (§75.19) instead of the sitespecific NOx emission rate, for any unit operating hour in which the required
parametric data (e.g., the water-to-fuel ratio) is unavailable or fails to
document that the emission controls are working properly.
Ø For a group of identical LME units, follow the same
basic rules as for single units, except that when it is appropriate to use the
highest 3-run average NOx
emission rate, apply the highest 3-run
average obtained at any tested load, for any tested unit, to all of the units
in the group.
•
If the NOx emission rate is based on historical CEMS data:
Ø Use the 95th percentile value
from each fuel-specific data set as the default NOx emission rate, with one exception—for units equipped with SCR or SNCR,
if the 95th percentile value is less than 0.15 lb/mmBtu, use 0.15
lb/mmBtu as the default NOx
emission rate.
![]()
____________________
6.1.6 What are the
recordkeeping and reporting requirements for LME
units?
For a LME unit, the
following essential records must be kept for three years, either on-site or (for
unmanned facilities) at a central location:
•
Records indicating
which hours the unit operated and, for each of these hours, the unit operating
time38;
•
The type(s) of fuel(s)
combusted during each operating hour;
•
The unit load during
each operating hour (megawatts or klb/hr of steam), if long-term fuel flow is
used to quantify heat input;
•
Calculated hourly SO2 , NOx and CO2 mass emissions (as applicable);
•
The methods used to
determine the hourly heat input values and the hourly NOx emission rates;
•
If the long-term fuel
flow method is used, the quantity of each type of fuel combusted in each
quarter, the GCV of each type of fuel, and the total quarterly heat input; and
•
For units with add-on
NOx emission controls or that use dry low-NOx technology, records of the parametric data to verify proper operation of
the emission controls (i.e., to justify using the site-specific NOx emission rates).
All of the above
information, except for the parametric data, must be reported quarterly to EPA
in a standardized electronic data reporting (EDR) format. However, note that a
data acquisition and handling system (DAHS) is not necessarily required to
generate the quarterly EDR reports for an LME unit. EPA’s Clean Air Markets
Division has developed a special LME module within its Monitoring Data Checking
(MDC) software, which is capable of generating quarterly EDRs for LME units42.
6.1.7 What are the
on-going QA/QC requirements for LME units?
Ongoing
quality-assurance is required for LME units only if the long-term fuel flow
option is used for heat input and/or if site-specific emission rates are used
to report emissions data. The quality control and quality-assurance (QA/QC)
provisions that must be implemented are as follows:
•
If site-specific NOx emission rates are used for reporting, these emission rates must be
re-determined every five years (20 calendar quarters);
•
For gaseous fuels other
than natural gas, annual sampling of the fuel’s total sulfur content is
required. The default SO2
emission rate currently in use must be
updated if the results of the annual sulfur sampling give an SO2 emission rate that exceeds the current value.
•
If site-specific
emission rates are used for reporting purposes, records must be kept of all
emission tests and/or data analyses used to determine the emission rates. These
records are kept until the emission rates are re-determined;
•
If the unit is equipped
with add-on NOx emission controls or dry low-NOx technology, and if site-specific NOx emission rates are used
for reporting purposes, a quality-assurance plan must be developed and kept
on-site, which explains the procedures used to document proper operation of the
emission controls. The plan must clearly define all of the parameters monitored
and the acceptable range(s) or value(s) for each parameter;
•
Fuel billing records
must be kept for three years, if that option is used for long-term fuel flow;
•
If the tank drop method
is used to quantify long-term oil flow, records must be kept for three years of
all quarterly measurements, and a copy of the API method used must be kept
on-file; and
•
If a certified Appendix
D fuel flowmeter is used for long-term fuel flow, the QA requirements in
section 2.1.6 of Appendix D must be met (see Section 4.8 of this guide).
6.1.8 What happens if a
low mass emissions unit loses its LME status?
If, at the end of a
calendar year or ozone season, it is determined that the emissions from an LME
unit have exceeded the applicable threshold value(s) in Table 13, above, the
unit’s LME status is lost at that point. When this occurs, §75.19 requires Part
75-compliant continuous monitoring systems to be installed and certified for
all parameters by December 31 of the calendar year following the year in which
LME status is lost. For example, if an Acid Rain-affected LME unit emits 125
tons of NOx in 2004, then Part 75 continuous monitoring systems
must be installed and certified by December 31, 2005 43. To meet the Part 75 monitoring requirement, CEMS, fuel flowmeters, or
the Appendix E methodology may be used, as appropriate. If the certification
deadline is not met, maximum potential values and conservative emission factors
must be used for reporting purposes until the certification tests are
completed.
LME status can also
be lost if a unit switches to a fuel other than oil or gas. In this case, the
unit loses its LME status as of the first hour that the new fuel is combusted,
and Part 75-compliant monitoring systems must be installed and certified prior
to the fuel switch44. If the monitoring requirement is not met on-time,
maximum potential values must be reported until the monitoring systems are
certified.
![]()
___________________
The CAMR rule, which
was published in the Federal Register on May 18, 2005, provides the blueprint
for a mercury cap and trade program that will affect all 50 states. The program
is scheduled to be implemented in 2009. The regulated units under CAMR are
coal-fired EGUs that serve a generator > 25 megawatts. The rule, which has
been codified as Subpart HHHH of 40 CFR Part 60, requires Hg mass emissions to
be monitored according to Part 75.
However,
prior to 2005, Part 75 did not have any Hg monitoring provisions. Therefore, as
part of the May 18, 2005 rulemaking, a new Subpart I was added to Part 75.
Subpart I (§§75.80-84) provides the necessary Hg mass emissions monitoring
guidelines for the trading program.
The available Hg
monitoring options are described in §75.81. For any affected unit in the program,
the owner or operator may install and certify an Hg CEMS or a sorbent trap
monitoring system to continuously monitor the Hg concentration. Both of these
monitoring options require the use of a stack flow monitor to convert the
measured Hg concentrations to mass emission rates. For sorbent trap systems and
Hg CEMS that measure on a dry basis, a correction for the stack gas moisture
content is also required.
For units with very
low annual Hg mass emissions (< 29 lb/yr), continuous monitoring of
the Hg concentration is not required. For these low mass emissions units,
Subpart I provides an alternative Hg monitoring methodology, which allows a
conservatively high default Hg concentration to be reported for each unit
operating hour (see §§75.81(b) through (f)). The default Hg concentration is
based on the results of emission testing.
In order for a unit
to qualify to use the low mass emissions methodology, the owner or operator
must perform Hg emission testing prior to January 1, 2009, to determine the Hg
concentration in the effluent gas stream. The testing consists of a minimum of
three runs at the normal unit operating load. If the unit is equipped with flue
gas desulfurization or add-on Hg emission controls, the controls must be
operating normally during the testing.
Based on the results
of the emission testing, the following equation is used to provide an estimate
of the annual Hg mass emissions from the unit:
![]()
Where:
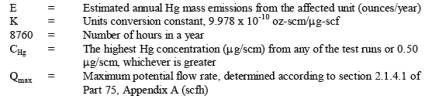
This equation gives a very
conservative estimate of the annual Hg emissions. It assumes that the unit
operates year-round at its maximum potential flow rate. If the highest Hg
concentration measured in any of the test runs is less than 0.50µg/scm, a
default value of 0.50µg/scm must be used in the calculations. Note also that this
methodology does not require a correction for the stack gas moisture content.
If the estimate of
the annual Hg mass emissions obtained from the equation above is 464 ounces per
year or less (i.e., < 29 lb/yr), then the unit is eligible to use the
low mass emissions methodology, and continuous monitoring of the Hg
concentration is not required. For each qualifying low mass emissions unit, the
owner or operator must submit the results of the Hg
emission testing to the
Administrator and to the permitting authority, no later than 45 days after the
testing is completed. The calculations demonstrating that the unit emits 464
ounces (or less) per year of Hg must also be provided, and the default Hg
concentration that will be used for reporting must be specified. The regulatory
agencies will treat the submittal as a certification application, and the
methodology will be considered to be provisionally certified as of the date and
hour of completion of the Hg emission testing.
Following initial
certification, the same default Hg concentration value that was used to
estimate the unit’s annual Hg mass emissions is reported for each unit
operating hour. The default Hg concentration value must also be updated
periodically, based on the results of additional required emission testing.
Re-testing is required either semiannually or annually, depending on the
results obtained in the previous test. If the estimated annual Hg emissions
from the previous test are < 144 ounces/year (9 lb/yr), the retest
frequency is annual and the next test is due in four “QA operating quarters”
(see footnote 63, below). If the estimated annual emissions exceed 9 lb/yr, the
retest frequency is semiannual and the next test is due in two QA operating
quarters.
If the low mass
emissions unit is equipped with a flue gas desulfurization system or add-on Hg
controls, the owner or operator must record the appropriate parametric data or
SO2 emission data for each unit operating hour, to
document proper operation of the emission controls. For any unit operating hour
in which this documentation is unavailable, the maximum potential Hg
concentration must be reported.
The low mass
emissions methodology may be used for reporting Hg mass emissions at common and
multiple stack configurations, if the following conditions are met.
•
For a common stack, all
units using the stack must be CAMR affected units and each unit must be tested
individually to demonstrate that it emits < 464 ounces of Hg per
year. If these conditions are met, the default Hg concentration used for
reporting at the common stack will either be the highest value obtained in any
test run for any of the units serving the common stack or 0.50 µg/scm,
whichever is greater.
•
For units with multiple
stack or duct configurations, Hg emission testing must be performed separately
on each stack or duct, and the sum of the estimated annual Hg mass emissions
from the stacks or ducts must not exceed 464 ounces of Hg per year. For
reporting purposes, the default Hg concentration used for each stack or duct
will either be the highest value obtained in any test run for that stack or
0.50 µg/scm, whichever is greater.
•
For units with a main
stack and bypass stack configuration, Hg emission testing is performed only on
the main stack. For reporting purposes, the default Hg concentration used for
the main stack will either be the highest value obtained in any test run or
0.50 µg/scm, whichever is greater. Whenever the main stack is bypassed, the
maximum potential Hg concentration must be reported.
At the end of each
calendar year, if the cumulative annual Hg mass emissions from a low mass
emissions unit have exceeded 464 ounces, the owner must install, certify,
operate, and maintain a Hg concentration monitoring system or a sorbent trap
monitoring system within 180 days after the end of the calendar year in which
the annual Hg mass emissions exceeded 464 ounces. For common stack and multiple
stack configurations, installation and certification of a Hg concentration or sorbent
trap monitoring system on each stack (except for bypass stacks) is likewise
required within 180 days after the end of the calendar year, if:
•
The annual Hg mass
emissions at the common stack have exceeded 464 ounces times the number of
affected units using the common stack; or
•
The sum of the annual
Hg mass emissions from all of the multiple stacks or ducts has exceeded 464
ounces; or
•
The sum of the annual
Hg mass emissions from the main and bypass stacks has exceeded 464 ounces.
7.0
PART 75 MONITORING SYSTEM CERTIFICATION PROCEDURES
7.1 How are Part 75
monitoring systems certified?
Before any data from
Part 75 monitoring systems can be reported as quality-assured, the systems must
pass a series of certification tests, to demonstrate that they are capable of
providing accurate emissions data. The overall monitoring system certification
process consists of several steps, as shown in Figure 3. The requirements of
each certification step are discussed in detail, below. Note that for low mass
emissions (LME) units, the certification process is somewhat different, and
therefore is discussed separately in section 6 of this guide.
7.2 Step 1—Submit an
Initial Monitoring Plan
For each affected unit,
an initial monitoring plan must be submitted at least 45 days prior to the
start of the certification testing of the monitoring systems. The monitoring
plan identifies the overall monitoring strategy for each unit. The plan must
contain sufficient information about the monitoring systems to demonstrate that
all of the regulated emissions from the unit will be measured and reported. The
monitoring plan consists of two parts:
•
Electronic, which includes the following information, arranged
in EPA’s standard electronic data reporting (EDR) format:
Ø Unit information, such as the unit type, the maximum
heat input capacity, the operating range of the unit (in terms of megawatts or
steam load), the type(s) of fuel combusted, the type(s) of emission controls, etc;
Ø Unit-stack configuration information, indicating how
the effluent gases from the unit discharge to the atmosphere--- i.e., through a
single stack or multiple stacks, or through a common stack shared with other
units;
Ø A description of the methodology used to monitor each
pollutant or parameter (e.g., CEMS, Appendix D, Appendix E, etc.).
Ø Monitoring system information, e.g., the pollutant or
parameter monitored by the system, the make, model and serial number of each
analyzer, etc;
Ø Mathematical formulas used to calculate emissions and
heat input; and
Ø Analyzer span and range information;
•
Hard copy, which includes supplemental information that is
incompatible with EDR format, such as:
Ø Schematic diagrams and blueprints;
Ø Data flow diagrams;
Ø Test protocols;
Ø Technical justifications; and
Ø Special documentation (e.g., fuel sampling data,
vendor guarantees, etc.)
The electronic
portion of the monitoring plan must be sent to the EPA Clean Air Markets
Division (CAMD)45, and the hard copy portion goes to the EPA Regional
Office and to the State Agency. CAMD uses its Monitoring Data Checking (MDC)
software to evaluate the electronic portion of the monitoring plan and sends
feedback to the source, to the State, and to the EPA Region. The State and EPA Regional
Offices then review the hard copy piece of the monitoring plan, together with
the feedback from CAMD on the electronic portion. The reviewing agencies
communicate their findings to the source and help to resolve any issues or
deficiencies identified during the review process.
The monitoring plan
is a “living” document, in that it must be continuously updated to reflect
changes to the monitoring systems over time. As technology advances, the
monitors originally described in the monitoring plan may be replaced, or the
monitoring methodology may be changed. Also, facility operations may change and
necessitate the use of additional monitors or alternative placement of existing
monitors. Therefore, for any modification, replacement, or other change to an
approved monitoring system or monitoring methodology, the monitoring plan must
be updated. For example, replacing a gas analyzer requires a monitoring plan
update, because Part 75 requires the make, model and serial number of each
analyzer to be reported.
Note that Part 75
allows all of the monitoring plan information, including the hard copy portion,
to be stored electronically, provided that a paper copy can be furnished to an
inspector or auditor upon request.
7.3 Step 2—Submit
Certification Test Notices
Certification test
notices must be sent to CAMD, to the EPA Regional Office and to the appropriate
State or local air agency, at least 21 days prior to conducting the required
certification testing. There is one exception to this--- for the certification
of Appendix D fuel flowmeters, the notifications are not required.
![]()
___________________
7.4 Step 3—Conduct
Certification Testing
The types of certification
tests required for Part 75 monitoring systems are described below:
•
7-day calibration
error test--- Evaluates the accuracy
and stability of a gas or flow monitor’s calibration over an extended period of
unit operation.
•
Linearity check—Determines whether the response of a gas monitor is
linear across its range
•
System integrity
check—For a mercury CEMS equipped
with a converter, this test verifies that the converter is working properly
•
RATA--- Compare emissions data recorded by a CEMS to data
collected concurrently with an EPA emission test method.
•
Bias test—Determines whether a monitoring system is biased low
with respect to the reference method, based on the RATA results. If a low bias
is found, a bias adjustment factor (BAF) must be calculated and applied to the
subsequent hourly emissions data. This test is required only for SO2, NOx, Hg, and flow monitoring systems.
•
Cycle time test—Determines whether a gas monitoring system is
capable of completing at least one cycle of sampling, analyzing and data
recording every 15 minutes.
•
Flowmeter Accuracy
test—Demonstrates that a fuel
flowmeter can accurately measure the fuel flow rate over the normal operating
range of the unit.
•
Four-load NOx emission rate testing and heat input measurement–Provides data for a correlation curve of NOx emission rate vs. heat input rate for an Appendix E peaking unit.
•
NOx emission rate testing at one or more unit loads—Determines fuel-and unit-specific NOx emission factors for LME units (optional).
•
DAHS verification—Ensures that all emissions calculations are being
performed correctly and that the missing data routines are being applied
properly.
The specific
certification tests required for each Part 75 monitoring system are shown in
Table 14. For the test procedures that must be followed, see the following
sections of Part 75:
•
For CEMS---Section 6 of
Appendix A.
•
For fuel flow
meters---Section 2.1.5 of Appendix D.
•
For Appendix E
testing---Section 2.1 of Appendix E.
•
For the data
acquisition and handling system---§75.20(c)(9)
7.5 Step 4—Submit
Certification Application
Within 45 days after completing
the required certification testing, a certification application must be
submitted. There are two parts to the application---electronic and hard copy.
•
The electronic part of
the application consists of a complete, updated monitoring plan and the results
of the certification tests, in EDR format. This part of the application is sent
to CAMD46.
•
The hard copy part of
the application consists of an application form, the hard copy certification
test report, and any changes made to the hard copy portion of the monitoring
plan as a result of the testing. This part of the application is sent to the
EPA Regional Office and to the appropriate State or local agency.
If the certification
application is incomplete or is missing any information, the reviewing agencies
will notify the source, and a reasonable amount of time will be given to submit
the required information. A 120-day review period begins when a complete
certification application has been received.
7.6 Step 5—Receive
Agency Approval or Disapproval
The appropriate
reviewing agency47 will issue a notice of approval or disapproval of the
certification application within 120 days of receiving the complete
application. While the application is pending, the monitoring systems are
considered to be “provisionally certified”. This means that data from the
monitoring systems are considered to be quality-assured, beginning at the date
and hour of completion of the certification tests48, and
continuing throughout the 120-day review period, provided that:
•
The monitoring systems
are operated in accordance with all applicable Part 75 requirements; and
•
A notice of disapproval
of the application is not issued in the meantime.
If the reviewing agency fails
to provide notice of approval or disapproval of the application by the end of
the 120-day review period, then, provided that all required tests were
successfully completed, the monitoring systems are considered to be certified
by default. During any period that the monitoring systems are not provisionally
or officially certified, the Part 75 missing data procedures must be used to
estimate emissions (see Section 9 of this guide).
![]()
____________________
7.7 What reference test
methods and standards are used for certification testing?
Various test methods,
some of which have been developed by EPA and others by reputable standards
organizations such as ASME, are used to certify Part 75 monitoring systems. In
addition, high-quality calibration gases are used in many of the certification
tests. These test methods and calibration standards are discussed below.
The certification
tests of Part 75 gas monitoring systems require the use of calibration gases,
either to calibrate the CEMS (e.g., for 7-day calibration error tests and
linearity checks) or to calibrate the reference method analyzers that are used
for RATAs. The calibration gas cylinders used for these tests are special gas
mixtures that have been prepared using a standard EPA protocol49. These protocol gas mixtures consist of known concentrations of the
pollutant or diluent gases of interest (e.g., SO2, NOx, CO2, etc.), in a non-reactive gas such as nitrogen.
To be acceptable for
use in Part 75 applications, a cylinder gas must meet the definition of
“calibration gas” in section 5 of Appendix A, and must be traceable to standard
reference materials prepared by the National Institute of Standards and
Technology (NIST). The only exception to this is purified instrument air, which
may be used as a zero gas or as an upscale calibration material for O2 analyzers.
Part 75 requires
periodic relative accuracy test audits (RATAs) of all CEMS, both gas and flow
monitoring systems. The RATA compares data from the CEMS to measurements made
with an EPA test method (known as a “reference method”). Reference methods are
also used for Appendix E NOx emission testing and to
determine fuel- and unit-specific NOx emission rates for
LME units. Except for the Ontario-Hydro method, which is an ASTM method, the
EPA reference test methods are found in Appendices A-1 through A-7 of 40 CFR
Part 60. The specific method(s) used for various Part 75 applications are
summarized in Table 15.
Fuel Flowmeter
Accuracy Standards
Part 75 sources using
Appendix D methodology are required to continuously monitor the fuel flow rate.
With few exceptions, certified fuel flowmeters are used for this purpose. Fuel
flowmeters are certified using test methods or, in some cases, design
specifications, that have been published by consensus standards organizations
such as ASME, AGA, and API. See section 4 of this guide for further discussion.
![]()
____________________
7.8 What performance
specifications must be met for certification?
For a Part 75 CEMS,
the performance specifications that must be met for initial certification are
found in section 3 of Appendix A. These specifications are summarized in Table
16. Table 16 shows that for certain tests, there is an alternative performance specification
in addition to the principal, or main specification. Generally speaking, the
purpose of the alternative specifications is to provide regulatory relief in
cases where the main specification may be too stringent. For example, for a
source with low SO2 emissions, an SO2 monitor may have
difficulty meeting the principal relative accuracy standard of 10.0%, but might
be able to meet the alternative specification, which is a mean difference of 15
ppm or less between the CEMS and reference method.
For fuel flowmeters,
the basic accuracy specification that must be met is 2.0% of the fullscale, or
“upper range value” (URV) of the flowmeter. For flowmeters that are calibrated
with a flowing fluid (e.g., in a laboratory), this accuracy specification must
be met at three points across the normal measurement range of the instrument,
i.e., covering the actual range of fuel flow rates that the meter will be used
to measure. For flowmeters that are certified by design (such as orifice
meters), the 2.0% of URV accuracy standard is considered to be met if the
primary element passes a visual inspection, and each of the pressure,
temperature and differential pressure transmitters is calibrated at 3 points or
“levels” (low, mid and high) across its normal measurement range, using
NIST-traceable equipment, and if:
•
The accuracy of each
transmitter is 1.0% of full-scale (or less) at each level; or
•
If, at a particular
level, the sum of the accuracies of the three transmitters is 4.0% or less.
7.9 What is meant by
the “span value”, and why is it important?
The “span value” is
an important concept in Part 75, for several reasons:
•
It provides a basis for
selecting the full-scale measurement range of a continuous monitor;
•
It is used to define the
upscale calibration gases (or calibration signals) that are used for daily
calibrations, linearity checks, and system integrity checks of Hg monitors;
•
C The principal
performance specifications for daily calibration error checks of SO2, NOx, Hg, and flow monitors are expressed as a percentage
of the span value; and
•
The performance
specification for system integrity checks of Hg monitors is expressed as a
percentage of the span value.
The span value is a
reasonable estimate, or “educated guess” of how large an analyzer scale (i.e.,
range) is needed to accurately record the emissions or flow rate data at a
particular monitored location. For each parameter monitored (e.g., SO2 , NOx, Hg, flow), Part 75 requires a high span value and a
corresponding full-scale measurement range to be defined in the monitoring
plan. For gases, the high span value is based on the maximum potential
concentration, or MPC. For flow, the span value is based on the maximum
potential flow rate, or MPF.
These maximum
potential values can be determined in a number of different ways. For instance,
depending on which gas is being monitored, the MPC may either be a “generic”
default value prescribed in Part 75, or it may be based on historical fuel
sampling data, emission test results, or historical CEM data. The MPF may
either be estimated using Equation A-1a or A-1b in Appendix A of Part 75, or
may be derived from measurements of stack gas velocity at maximum load.
Once the MPC or MPF
has been determined, the high span value is set by multiplying the MPC or MPF
by a factor of 1.00 to 1.25, and rounding off the result appropriately50. Thus, the span value may either be set equal to or slightly higher
than the maximum potential value. After determining the span value, the full-scale
range of the monitor must be set. Part 75 requires the range to be greater than
or equal to the span value. However, note that when setting the range, the
guidelines in section 2.1 of Appendix A should be taken into account, to avoid
setting it too high. According to section 2.1, the range should (with certain
exceptions, described below) be selected to ensure that the majority of the
data fall between 20% and 80% of full-scale.
For many Part 75
units, the use of high span values and full-scale ranges derived from the
maximum potential values is sufficient to ensure that data are accurately
recorded. However, for units with add-on SO2, NOx, or Hg emission controls, or for units that burn multiple fuels with
distinctly different SO2
or NOx emission rates, it
may be necessary to define a second, low span value and a low range. A low span
and range will be required if the emission levels are expected to be
consistently below 20% of the high range51 when the add-on
emission controls are operating properly, or when the lowest-emitting fuel is
burned.
If a second span and
range are required, the low span value is set in a similar manner to the high
span value. The only difference is that the low span is based on the maximum
expected concentration (MEC), rather than the MPC. The MEC is the highest that
the concentration of the pollutant is expected to be when the add-on controls
are in normal operation or when the lowest emitting fuel is combusted. There
are a number of ways to determine the MEC. For units with add-on emission
controls, it may be based on the expected efficiency of the controls. Emission
test data, historical CEM data, or an emission limit in the operating permit
may also be used to determine the MEC. Once the MEC has been established, the
low span value is calculated by multiplying the MEC by a factor of 1.00 to 1.25
and rounding off the result appropriately52. Then, the low
range is set greater than or equal to the low span value.
____________________
Note that for units
with dual SO2 or NOx spans, Part 75 allows a
“default high range value” to be reported when the emissions go off the low
scale, as an alternative to maintaining and calibrating a high monitor range.
But the default high range value is a very high number (200% of the MPC) and
grossly overstates the emissions. Therefore, this option is probably not a good
one except for sources whose emissions rarely, if ever, exceed the full-scale
of the low range. Note also that for dual-span units there are exceptions to
the “20-to-80% of range” guideline in section 2.1 of Appendix A. For instance,
provided that the low span and range have been set according to the rule, the
low range is exempted from this guideline. And if the add-on emission controls
are operated year-round, the high range is similarly exempted.
An unusual feature of
Part 75 is that for flow monitors, there is only one measurement range, but
there are two span values— the “calibration span value” and the “flow rate span
value”. These two span values are both derived from the MPF and are actually
equivalent, but almost invariably they are expressed in different units of
measure. The calibration span value is the one used for daily calibrations of
the flow monitor. Often it is expressed in units such as inches of water (in. H2O) or thousands of standard cubic feet per minute (kscfm), depending on
the type of flow monitor. The flow rate span value is always in units of
standard cubic feet per hour (scfh), which are the units of measure prescribed
by Part 75 for reporting hourly stack gas flow rates.
Once the span values
for all of the required continuous monitors have been established, these values
are used for daily calibration assessments, Hg monitor system integrity checks,
and linearity checks, as follows:
•
For the daily
calibrations of gas monitors, zero and upscale gases are used. The zero gas
must be 0 to 20% of the span value, and the upscale gas may be either a mid
level gas (defined as 50 to 60% of the span value) or a high level gas (80
to100% of the span value).
•
For the daily
calibrations of flow monitors, a zero calibration signal (0 to 20% of the
calibration span value) and an upscale calibration signal (50 to 70% of the
calibration span value) are used.
•
For weekly system integrity
checks of Hg CEMS, a mid-level or high-level calibration standard, with a
concentration of 50 to 60% or 80 to 100% of the span value, is required.
•
For linearity checks of
gas monitors and 3-level system integrity checks of Hg CEMS, calibration is
required at three different gas levels (low, mid, and high), using calibration
standards with concentrations of 20 to 30%, 50 to 60%, and 80 to 100% of the
span value, respectively.
•
The principal
performance specification for certain daily calibration error tests are
expressed as a percentage of the span value. For an SO2 , NOx , or Hg monitor, the performance specification is +
5.0% of the span value, and for a flow monitor, it is + 6.0% of the
calibration span value; and
•
The performance
specification for single- and 3-level system integrity checks of Hg monitors is
5.0% of the span value.
Finally, Part 75
requires periodic evaluations (at least once a year) of the MPC, MEC, span and
range values. These evaluations are done by reviewing the emissions and flow
rate data from the previous four quarters. If any of the MPC, MEC, span and/or
range values are found to be improperly set, the necessary adjustments must be
made within 45 days (or within 90 days if new calibration gases must be
ordered) after the end of the quarter in which this is discovered.
7.10 Recertification
and Diagnostic Testing
Whenever a
replacement, modification, or other change is made to a monitoring system that
may affect the ability of the system to accurately measure emissions, the
system must be recertified. Also, changes to the flue gas handling system or
manner of unit operation that affect the flow profile or the concentration
profile in the stack may trigger recertification. Examples of situations that
require recertification of Part 75 monitoring systems include:
•
Replacement of an
analyzer.
•
Replacement of an
entire CEMS.
•
Change in location or
orientation of a sampling probe
•
Fuel flow meter
replacement.
•
Exceedance of Part 75
Appendix E operating parameters for more than 16 consecutive operating hours
The requirements for
recertification are basically the same as those shown in Figure 3, above, for
initial certification. A recertification application must be submitted within
45 days of completing the required tests and a 120-day period is allotted for
the regulatory agencies to review the application. However, note that for
recertifications, an initial monitoring plan submittal is not required, and the
test notification requirements are slightly different from those for initial
certification.
Not all changes made
to a certified monitoring system require recertification. In many cases, only
diagnostic testing is required to ensure that the system continues to provide accurate
data. Note also that in some instances EPA requires less than a full battery of
tests for recertification. For a more thorough discussion of recertification
and diagnostic testing, see §75.20(b) and Questions 13.21 and 16.14 through
16.16 in EPA’s “Part 75 Emissions Monitoring Policy Manual”53.
![]()
____________________
8.0
QUALITY ASSURANCE and QUALITY CONTROL (QA/QC) PROCEDURES
8.1 Does Part 75
require periodic quality QA/QC testing after a monitoring system is certified?
If so, where are these test requirements found?
Following initial
certification, all Part 75 monitoring systems are required to undergo periodic
quality-assurance testing, to ensure that they continue to provide accurate
data.
•
For CEMS, the QA test
requirements are found in either:
Ø Appendix B of Part 75 and §75.21, for sources that
report emissions data year-round; or
Ø Section 75.74(c), for NOx Budget Program or CAIR Ozone SeasonTrading Program sources that report
emissions data only during the ozone season, from May 1st through September 30th;
•
For sorbent trap
monitoring systems, the QA requirements are found in Appendices B and K of Part
75;
•
For Appendix D fuel
flowmeter systems, the on-going QA test requirements are in section 2.1.6 of
Appendix D; and
•
For Appendix E NOx correlation curve systems, the QA requirements are found in sections 2.2
and 2.3 of Appendix E.
8.2 What are the
on-going QA test requirements in Part 75 for units reporting emissions data
year-round?
Year-round reporting
of emissions data is required for all Acid Rain Program units, all CAIR SO2 Trading Program units, and for certain NOx Budget
Program and CAIR NOx Trading Program units (see Section 8.5, below). For
CEMS, the on-going QA test requirements for year-round reporters are summarized
in Table 17. Table 17 shows that routine QA testing of CEMS is required at four
basic frequencies:
•
Daily;
•
Weekly;
•
Quarterly; and
•
Semiannual or Annual.
Calibration error
checks of all monitors and interference checks of flow monitors are required
daily. For Hg CEMS with converters, system integrity checks are required
weekly. Gas monitor linearity checks, flow-to-load ratio tests, and leak checks
(for DP-type flow monitors) are required quarterly. RATAs are required either
semiannually or annually, depending on the type of monitor and/or the results
of the tests (see Section 8.6, below).
For Appendix D fuel
flowmeters, the basic frequency for the required accuracy tests is annual. For
Appendix E systems, NOx emission testing is required once every five years,
in order to develop new correlation curves.
Table 18 summarizes
the on-going QA requirements for sorbent trap monitoring systems.
8.3 Are there any
exceptions to these basic QA test requirements?
Yes. Table 17 indicates
that there are some exceptions to the basic QA test requirements and
frequencies for year-round reporters. For instance:
•
Linearity checks are
not required for SO2 or NOx monitors with span values of 30
ppm or less;
•
For calendar quarters
in which the unit operates for less than 168 hours, limited exemptions from
linearity checks and limited extensions of RATA deadlines are available;
•
RATAs of SO2 monitors are not required if the unit exclusively combusts “very low
sulfur fuel” (as defined in §72.2) or limits combustion of higher-sulfur fuel
to <480 hours per year;
•
For calendar quarters
in which a particular fuel is combusted for less than 168 hours, limited
extensions of fuel flowmeter accuracy test deadlines are available to Appendix
D units; and
•
For calendar quarters
in which the optional fuel flow-to-load ratio test is performed and passed,
limited extensions of fuel flowmeter accuracy test deadlines are available to
Appendix D units.
The low-span
linearity check exemption described in the first bulleted item above and the SO2 RATA exemption described in the third bulleted item are permanent
exemptions, as long as the conditions continue to be met. However, the test
extensions and exemptions described in the second, fourth and fifth bulleted
items above are conditional and have definite limits, i.e., no more than 3
consecutive linearity check exemptions may be claimed, a RATA deadline may not
be extended beyond 8 calendar quarters from the quarter of the last test, and
the accuracy test deadline for a fuel flowmeter may not be extended beyond 5
years (20 quarters) from the quarter of the previous test.
EPA also recognizes
that circumstances beyond the control of the source owner or operator, such as
a forced unit outage, may prevent a linearity check or RATA from being done in
the calendar quarter in which it is due. To provide regulatory relief in these
instances, Part 75 allows the test to be done in a grace period, immediately
following the end of that quarter. For a linearity check, the grace period is
168 unit operating hours, and for a RATA it is 720 unit operating hours.
Provided that the missed QA test is performed and passed on the first attempt
within the grace period, no loss of emissions data will be incurred by the
affected source.
8.4 Are there any
special considerations when performing these basic QA tests?
Yes, there are a
number of things must be taken into consideration when performing the QA tests,
to ensure that they are done properly:
•
Daily calibration error
tests, interference checks, and linearity checks must be done while the unit is
on-line (i.e., combusting fuel). The only exception to this is that off-line
calibration error tests may be used to validate up to 26 consecutive hours of
emissions data, if the off-line calibration error demonstration described in
section 2.1.5 of Appendix B has been performed and passed.
•
All RATAs of gas
monitors must be done at normal load, while combusting a fuel that is normal for
the unit. For the RATA of an Hg monitoring system, the unit must be burning
coal. Normal load is defined in the monitoring plan as the most frequently used
load level (low, mid, or high). To determine the normal load:
Ø First, the unit’s range of operation is defined. It
extends from the “minimum safe, stable load” to the “maximum sustainable load”.
Ø Second, the operating range is divided into three
load bands, or levels. The first 30% of the range is defined as low load, the
next 30% is mid load, and the remainder of the range is high load.
Ø Third, at least four quarters of representative
historical load data are analyzed54, to determine
which load levels are used the most frequently. The load level used most
frequently must be designated as the normal load. The load level that is used
second most frequently may be designated as a second normal load level55.
•
For flow monitors
installed on peaking units and bypass stacks, only single-load RATAs are
required.
•
For all other flow
monitors:
Ø The annual RATAs must be done at the 2 most
frequently used load levels or (at the source’s discretion) at all 3 loads,
unless
Ø The unit has operated at one load level (low, mid or
high) for > 85% of the time since the last annual flow RATA, in which
case a single-load test at normal load may be performed.
Ø A 3-load RATA is required at least once every 5
calendar years
•
If a semiannual RATA
frequency56 is obtained, an additional RATA must be done
in-between the annual RATAs. For a flow monitor, this “extra” RATA may be a
single-load test at normal load.
•
For units that do not
produce electrical or steam load, such as cement kilns, and refinery process
heaters, the RATA requirements are basically the same as for load-based units, except
that the terms “level” and “operating level” apply instead of the terms “load”
and “load level”. Also, it is possible, with a proper justification in the
monitoring plan57, for a non load-based unit to be partly or fully
exempted from performing multi-level flow RATAs.
____________________
•
The quarterly
“flow-to-load ratio test” is not actually a test at all. Rather it is a data
analysis, which, in most cases, is performed automatically by the DAHS. The
purpose of the test is to ensure that flow monitors continue to provide
accurate data in-between RATAs. The “test” is performed as follows:
Ø The hourly ratio of the stack gas flow rate to unit
load is calculated for a segment of the quarterly flow rate data (i.e., those
hours where the load was within 10% of the average load during the last normal
load flow RATA).
Ø These hourly ratios are then compared against a
“reference” flow-to-load ratio, which is the ratio of the average reference
method flow rate to the average unit load from the last normal-load RATA.
Ø Alternatively, the data analysis may be done on the
basis of the “gross heat rate”58 (GHR), which is the ratio of
heat input rate to unit load), rather than using the flow-to-load ratio.
8.5 What are the
on-going QA test requirements for ozone season-only reporters?
If a unit is in the
NOx Budget Trading Program but is not an Acid Rain
Program unit, emissions data may be reported on an ozone season-only basis
rather than year-round, if this is allowed by the State regulation. Ozone season-only
reporting is also allowed for units that are in the CAIR Ozone Season Trading
Program and are not otherwise required to report year-round. If ozone
season-only reporting is permitted and this option is selected, the quality
assurance procedures under §75.74 (c) in Subpart H of Part 75 must be met.
These procedures require some pre-ozone season quality assurance testing
between October 1 and April 30, and other QA testing inside the ozone season
(May 1st through September 30th).
The QA test requirements
for ozone season-only reporting are considerably different from, and quite a
bit more complex than, the requirements for year-round reporters. For example:
•
The required pre-season
linearity check of a gas monitor may be done in April (2nd quarter). However, if the unit operates for >
168 hours in May and June, an additional 2nd quarter linearity
check is required;
•
The “window” of data
validation for a RATA extends only for 2 calendar quarters (for semiannual frequency)
or 4 calendar quarters (for annual frequency). The “QA operating quarter”
concept (see Table 17) may not be used to extend RATA deadlines;
•
Daily calibrations must
be performed from the date and hour of any pre-ozone season linearity check or
RATA , through April 30th;
•
If a RATA was performed
inside the ozone season, the test may be used to validate data in the next
ozone season, but only if these conditions are met:
Ø The data validation window from the RATA extends into
the next ozone season; and
Ø The monitoring system is maintained and operated, and
daily calibrations are performed, throughout the entire pre-ozone season period
from October 1st of the current year through April 30th of the next year.
These are but a few
of the QA provisions in §75.74(c). For a complete listing, see Table III-A in
Appendix III of this guide. In view of this, sources that qualify to use the
ozone season-only reporting option should carefully weigh the perceived
benefits of this option, such as reduced reporting requirements and less
required maintenance of CEMS during the off-season, against the potential
invalidation of emissions data (and consequent loss of NOx allowances) that could result from a misunderstanding or misapplication
of the rule requirements.
8.6 What performance
specifications must be met for the routine QA tests required by Part 75?
The performance
specifications for the routine Part 75 QA tests are basically the same as for
initial certification (see Table 16 in Section 7 of this guide). There are,
however, a few notable exceptions:
•
For daily calibration
error tests of SO2, NOx, CO2, O2, and flow monitors, the calibration error (C.E.)
specifications are twice as wide as the C.E.’s allowed in the 7-day calibration
error test for initial certification. For example, when an SO2 monitor is certified, the maximum allowable C.E. during the 7-day
calibration error test is ± 2.5% of the span value, but the “control limits”
for daily operation of the monitor are ± 5.0% of span.
•
For SO2 and NOx monitors with span values of 50 ppm or less (which
are exempted from the 7-day calibration error test), the control limits for
daily calibration error tests are either ± 5.0% of span or |R – A| <5
ppm.
•
For RATAs, there is an
incentive system that rewards good monitor performance. RATAs may be performed
annually rather than semiannually if a certain level of relative accuracy is
achieved59. The relative accuracy test frequency incentive
system is summarized in Table 19. Table 19 shows that when the percent relative
accuracy is 7.5% or less, the test frequency is annual. But even if 7.5% RA is
not achieved, the monitoring system may still be eligible for an annual RATA
frequency, if an alternative relative accuracy specification is met. The
alternative specifications are also shown in Table 19, and they apply to:
Ø Low emitters of SO2 and NOx ;
Ø Sources with very low stack gas velocities; and
Ø Moisture, CO2 , and O2 monitoring systems.
In each case, the alternative
RA specification is the difference between the mean values of the reference
method and CEMS measurements from the RATA.
![]()
![]()
____________________
8.7 Are there any
notification requirements for the periodic QA tests?
Yes. Part 75 requires
sources to provide notice to CAMD, to the EPA Regional Office, and to the
State, at least 21 days in advance of the following QA tests:
•
RATAs
•
Appendix E retests
•
LME unit retests
Part 75 also allows any of
the regulatory agencies to issue a waiver from these notification requirements.
CAMD has waived these notification requirements. Therefore, sources are
currently required to notify only the State and EPA Region, unless those
agencies issue a similar waiver.
8.8 What are the Essential
Elements of a Part 75 QA/QC Program?
Part 75 requires all
owners and operators of affected units to develop and implement a quality
assurance/quality control (QA/QC) program for the continuous monitoring
systems. Each QA/QC program must include a written plan60 that describes in detail the step-by-step procedures and operations for
a number of important activities. This quality assurance plan must be made
available to the regulatory agencies upon request during field audits. The
following are the essential elements that must be included in a QA plan:
•
For all monitoring
systems:
Ø The routine maintenance procedures for the monitoring
system, and a maintenance schedule;
Ø The procedures used to implement the Part 75
recordkeeping and reporting requirements;
Ø Records of all testing, adjustment, maintenance,
repair of the monitoring system (e.g., maintenance logs); and
Ø Records of corrective actions taken in response to
monitoring system outages.
•
For CEMS:
Ø A written record of the procedures used for the required
QA tests (i.e., daily calibration, linearity checks, RATAs, etc.);
Ø The procedures used to adjust the CEMS to ensure
accuracy; and
Ø For units with add-on SO2, NOx, or Hg emission controls, a list of the parameters
that are monitored during monitor outages to verify that the controls are
working properly, and the acceptable values and ranges of the parameters.
•
For sorbent trap
monitoring systems:
Ø Procedures for permanently marking or inscribing an identification
number on each sorbent trap, for tracking purposes;
Ø An explanation of the procedures used for leak checks
of the traps when they are placed in or removed from service;
Ø Other procedures that are used to ensure system
integrity and data quality, including dry gas meter calibrations, verification
of moisture removal, ensuring air-tight pump operation;
Ø The QA/QC criteria of Part 75, Appendix K;
Ø The chain of custody procedures used in the packing,
transporting and analysis of the sorbent traps;
Ø Documentation that the laboratory performing the
analyses of the traps either meets the requirements of ISO 17025, or performs
and passes the spike recovery study described in Appendix K at least once a
year;
Ø The rationale for the minimum acceptable data collection
time for the size of sorbent trap selected; and
Ø A detailed description of the procedures used for
RATAs of the sorbent traps.
![]()
____________________
•
For units using the
Appendix D and E methodologies:
Ø A written record of the fuel flowmeter accuracy test
procedures, including (if applicable) transmitter calibration and visual
inspection procedures;
Ø A record of all adjustments, maintenance or repairs
of the fuel flowmeter monitoring system;
Ø A written record of the standard procedures used to
perform the periodic fuel sampling and analysis;
Ø For Appendix E units, a list of the operating
parameters that are continuously monitored, and acceptable ranges for the
parameters; and
Ø A record of the procedures used to perform the
required Appendix E NOx emission testing.
•
For pertinent
information concerning the QA/QC requirements for LME units, see Section 6.1.7
of this guide.
9.0
MISSING DATA SUBSTITUTION PROCEDURES
9.1 Does Part 75
require emissions to be reported for every unit operating hour?
Yes. In cap and trade
programs, sources are accountable for their emissions during each hour of unit
operation, because compliance is assessed by comparing the total mass emissions
for the compliance period (i.e., year or ozone season) to the total number of
allowances held. Therefore, Part 75 requires a complete data record for each
affected unit. Emissions data must be reported for each unit operating hour,
without exception.
9.2 How are emissions
data reported when a monitoring system is not working?
In real-life
situations, quality-assured emissions data may not be available for some hours,
because monitoring equipment occasionally malfunctions or needs to undergo
routine maintenance. Also, routine QA tests are sometimes not performed on
schedule or are failed. For any unit operating hour in which a monitoring
system is unable to provide quality-assured data, the system is considered to
be “out-of-control” (OOC). Data recorded by an out-of-control monitoring system
are unsuitable for Part 75 reporting and may not be used in the emission
calculations. For each hour of an OOC period, emissions data must be provided
in one of the following ways:
•
Using an approved Part
75 backup monitoring system that is not out-of-control; or
•
Using an EPA reference
test method; or
•
Using an appropriate
substitute data value.
Many facilities do
not have backup monitoring systems, and even if they do, there is no guarantee
that the backup monitor will be in-control during an outage of the primary
monitor. Using EPA reference methods to collect data can be expensive and
time-consuming. In view of this, there needs to be a standard methodology for
determining appropriate substitute data values during missing data periods. The
necessary missing data procedures are found in the following sections of Part
75:
•
§§75.31 through 75.38,
for units that use CEMS and report emissions data on a year-round basis;
•
§75.39 for sorbent trap
monitoring systems
•
§75.74 (c)(7), for NOx Budget Program units that use CEMS and report emissions data on an ozone
season-only basis;
•
Section 2.4 of Appendix
D;
•
Section 2.5 of Appendix
E; and
•
Section 5 of Appendix G
The Part 75 missing data
substitution process is shown in Figure 4.
9.3 What are the Part
75 missing data procedures for CEMS ?
In general, the Part
75 missing data procedures for CEMS are designed to provide conservatively high
substitute data values, to ensure that emissions are not underestimated during
monitor outages. Application of the missing data procedures begins either at
the date and hour of provisional certification, when the CEM systems have
passed all required certification tests and begin generating quality-assured
data, or when the certification deadline expires, if the monitoring
systems have not passed all of the required tests.
Two distinct sets of
CEMS missing data algorithms are described in Part 75---the “initial” and the
“standard” missing data routines. The initial missing data algorithms in §75.31
are temporary “spin-up” procedures that are used for a specified period of
time, after which the standard missing data algorithms in §§75.33 through 75.38
begin to be applied61. For both the initial and standard missing data
procedures, all of the appropriate substitute data values are calculated and
applied automatically by the data acquisition and handling system (DAHS). If a
missing data period extends past the end of a quarter, it is treated as two
separate missing data periods, one terminating at the end of the quarter and
one starting at the beginning of the next quarter.
The initial missing
data procedures are used until a certain number of hours of quality-assured CEM
data have been obtained. For SO2, Hg, CO2, O2, and moisture, this number is 720 hours, and for NOx and flow rate, it is 2,160 hours. The initial missing data algorithms
are simple and the substitute data values derived from them are likely to be
close to the actual values. For example, the algorithm for SO2 is the arithmetic average of the SO2 concentrations from
the hour before and the hour after the missing data period. For NOx and flow rate, the substitute data value for each hour is an arithmetic
average of the available historical data at similar load levels.
Once the requisite
number of hours of quality-assured data has been obtained (i.e., 720 or 2,160),
use of the initial missing data procedures ceases and the standard missing data
procedures begin to be applied.62 The standard missing data
routines use a tiered approach, that takes into account both the percent
monitor data availability63
(PMA) and the length of the missing data
period. When the PMA is high (> 95%) and the missing data period is
relatively short (< 24 hr), the standard missing data algorithms are
nearly identical to the initial missing data routines---consequently, the substitute
data values are generally not punitive. However, as the PMA decreases, the
substitute data values become increasingly conservative, to ensure that
emissions are not under-reported.
_____________________
For example, when the
PMA of an SO2 or NOx monitoring system is between
80% and 90%, the substitute data value will be the maximum value observed by
looking back through the last 720 hours (for SO2) or 2,160
hours (for NOx) of historical, quality-assured emission data64. But if the PMA drops below 80%, regardless of the length of the
missing data period, the maximum potential SO2 concentration
or the maximum potential NOx emission rate must be reported.
For units with add-on
SO2, NOx, or Hg emission controls, the use
of the initial and standard missing data routines is conditional. The condition
is that parametric data must be available to document that the add-on controls
are working properly during the missing data period. For any hour in which this
parametric evidence is unavailable, the maximum potential concentration or the
maximum potential emission rate must be reported.
The initial and
standard missing data algorithms for NOx and stack gas flow
rate are load-based, in order to provide more representative substitute data
values. Appendix C of Part 75 requires the owner or operator to establish 10
load ranges or “load bins”, by dividing the operating range of the source
(e.g., 0 to 500 megawatts) into 10 equal parts65. Then,
during periods of missing NOx or flow rate data, the
substitute data value for each hour is calculated using historical
quality-assured data in the corresponding load bin.
However, certain
units in the NOx Budget Program, such as cement kilns and refinery
process heaters, do not produce electrical or steam load. To accommodate these
sources, EPA added a series of special missing data algorithms for NOx and flow rate to Part 75 in 2002. The algorithms are structurally
similar to the standard NOx
and flow rate missing data routines,
except that they are not load-based. To alleviate industry concerns that the
substitute data values determined in this manner may not be representative, the
rule allows the affected sources to define “operational bins” corresponding to
different process operating conditions, and to populate each bin with CEM data.
The substitute data value for each missing data hour is then drawn from the
appropriate operational bin.
As part of the 2002
revisions to Part 75, EPA also added provisions to §§75.33 and 75.34. These new
provisions allow sources to implement the standard missing data routines in a
slightly different manner, in order to obtain more representative substitute
data values. Affected sources that burn different types of fuel now have the
option to separate their historical CEM data according to fuel type and to
apply the standard missing data procedures on a fuel-specific basis. Also, for
a unit that is subject to the NOx Budget Program or to the CAIR
Ozone Season Trading Program, and is equipped with add-on NOx controls, and reports emissions data year-round, the owner or
operator may separate the NOx emission data into ozone season
and non-ozone season data “pools”. Then, depending on the time of the year that
the missing data period occurs (i.e., inside or outside the ozone season), the
substitute data values are drawn from the appropriate data pool. This missing
data option is advantageous when the NOx emission controls
are operated only (or principally) during the ozone season.
_____________________
9.4 What are the
missing data procedures for Appendices D, E and G?
Appendix D of Part 75
includes missing data procedures for fuel flow rate, fuel sulfur content, GCV
and density. The Appendix D missing data algorithms are considerably less
complex than the CEMS missing data routines. The standard Appendix D missing
data algorithms for fuel flow rate are the most sophisticated, in that they are
fuel-specific and load-based. However, the substitute data value for each hour
is simply an arithmetic average of the data in the corresponding load bin,
based on a look back through 720 hours of quality-assured data66.
Appendix D requires
missing data substitution for fuel sulfur content, GCV and density whenever a
required periodic sample for any of these parameters is not taken, or when the
results of a sample analysis are missing or invalid. The missing data approach
is quite simple, in that the maximum potential value of the parameter is
reported for each hour of the missing data period. Fuel-specific maximum
potential values for sulfur content, GCV and density are defined in Table D-6
of Appendix D. In some cases, a conservatively high default value is prescribed
(e.g., 1.0% sulfur for diesel fuel). In other cases, a multiplier is applied to
the highest value in a look back through recent fuel sampling results (e.g.,
1.5 times the highest sulfur content from the previous 30 daily gas samples).
____________________
For Appendix E units,
missing data substitution is required for any unit operating hour in which:
•
One or more of the
monitored QA/QC parameters is either unavailable or outside the acceptable
range of values; or
•
The measured heat input
rate is higher than the highest heat input rate from the baseline correlation
tests; or
•
For a unit with add-on
NOx emission controls, the controls are either shut off
or cannot be documented to be working properly; or
•
Emergency fuel is
combusted, unless a separate correlation curve has been derived for the fuel.
Appendix E missing
data substitution is fairly straightforward. When the QA/QC parameters are
unavailable or outside the acceptable range of values, the substitute data
value is simply the highest NOx emission rate from the baseline
correlation curve. When the measured heat input rate is above the highest value
from the baseline testing, there are two missing data options for NOx emission rate. Either:
•
Report the higher of
the linear extrapolation of the correlation curve or the maximum potential NOx emission rate (MER); or
•
Report 1.25 times the
highest value on the correlation curve, not to exceed the MER.
The fuel-specific MER must
be reported for units with add-on NOx emission controls,
whenever the controls are either shut off or cannot be documented to be working
properly. The MER must also be reported when emergency fuel is combusted, if
there is no baseline correlation curve for that fuel.
For Acid Rain Program
units using Appendix G to determine CO2 mass emissions,
missing data substitution is required whenever the results of the required fuel
sampling and analysis for carbon content or GCV are missing or invalid. For
periods of missing carbon content, either the appropriate default value from
Table G-1 in Appendix G or the results of the most recent valid sample may be
reported. When the GCV is missing, Table D-6 in Appendix D is used to determine
the substitute data value.
9.5 What is conditional
data validation?
When a significant
change is made to a CEMS (e.g., replacement of an analyzer) and the system must
be recertified, the CEMS must pass a series of recertification tests before it
can be used to report quality-assured data. In most cases, recertification
takes at least 7 days (since a 7-day calibration error test is usually one of
the required tests). However, while the recertification tests are in progress,
the requirement to report emissions data for every unit operating hour remains
in effect. Without regulatory relief, this could result in an extended period
of missing data substitution, and possible loss of allowance credits.
To alleviate this
situation, §75.20(b)(3) of Part 75 allows conditional data validation (CDV) to
be used for recertification events. Conditional data validation provides a
means of minimizing the use of substitute data while a CEMS is being tested for
recertification. To take advantage of this rule provision, as soon as the
monitoring system is ready to be tested, a calibration error test is performed. This is called a “probationary
calibration”. If the probationary calibration is passed, data from the CEMS are
assigned a conditionally valid status from that point on, pending the results
of the recertification tests.
If the required recertification
tests are then performed and passed within a certain time frame67, with no test failures, all of the conditionally valid data recorded by
the CEMS from the date and hour of the probationary calibration to the date and
hour of completion of the required tests may be reported as quality-assured.
However, if one of the major recertification tests (such as a linearity check
or RATA) is failed, then all of the conditionally valid data are invalidated
and missing data substitution must be used until all of the required tests have
been successfully completed.
____________________
Part 75 extends the
use of conditional data validation beyond recertification events. The
procedures may also be used for initial certification, diagnostic testing, and
for routine QA testing. The application of conditional data validation to
initial CEMS certification is particularly advantageous for new sources in the
NOx Budget Program, which are accountable to report NOx mass emissions from the hour of unit start up (i.e., “first-fire”). The
use of CDV for these new sources allows a significant amount of the data
recorded prior to completion of the certification tests to be reclaimed and
reported as quality-assured— data which otherwise would be invalidated and reported
as maximum potential values. Note that if CDV is used for initial
certification, it may be used for the entire window of time allotted for
certification (up to 180 days in some cases), and the shorter time frames
described in §75.20(b)(3)(iv) do not apply80. Conditional data
validation is also useful when:
•
Monitor repair or
maintenance activities are performed that trigger diagnostic test requirements;
or
•
A routine QA test, such
as a linearity check or RATA is failed or aborted due to a problem with the
monitoring system and must be repeated.
In these instances, a
probationary calibration may be done following corrective actions, and the CDV
procedures applied until the required diagnostic test or QA test has been
performed.
10.0 PART 75 REPORTING REQUIREMENTS
10.1 What are the basic
reporting requirements of Part 75?
Under the Acid Rain
and NOx Budget Programs, electronic and hard copy data of
various kinds (e.g., emissions data, monitoring plan information, results of
certification and QA tests. etc.) must be reported to EPA and to the State at
certain times, as specified in Part 75.
Initial
Reporting
The initial Part 75
reporting requirements include the submittal of a monitoring plan and the results
of the monitoring system certification tests. These requirements have been
previously discussed in Section 7 of this guide.
Quarterly
Reporting
In general, emissions
data must be reported electronically each quarter, beginning either at the date
and hour of provisional certification when all certification tests have been
completed or the date and hour of the certification deadline specified in the
rule, whichever comes first68. EPA uses the quarterly report
data to assess compliance, by comparing each unit’s reported annual SO2 mass emissions and/or ozone season NOx mass emissions
against the number of allowances held. For coal-fired units with annual NOx emission limits under 40 CFR Part 76, the Agency also assesses
compliance with these limits.
Quarterly reporting
of hourly emissions data is vital to the success of a cap and trade program.
Quarterly reporting eases the administrative burden associated with the data
reconciliation and allowance accounting process, because it enables EPA and the
affected sources to work together during the year or ozone season to address
any problems with the data, rather than waiting until the year or ozone season
is over.
All quarterly reports
must be submitted to EPA by direct computer-to-computer transfer, either by
E-mail or by using an EPA-provided software tool known as the Emissions
Tracking System File Transfer Protocol, or “ETS-FTP”. The reports are due
within 30 days after the end of each calendar quarter. During this 30-day
submission period, the reports may be revised and resubmitted as many times as
necessary.
The data in each quarterly
report must be in a standardized electronic data reporting (EDR) format
provided by EPA69. The data acquisition and handling system (DAHS)
must be capable of recording all of the necessary data and putting it into this
format. Currently, there are two versions of the EDR, i.e., versions 2.1 and
2.2. Most affected units use version 2.1 and have the option to upgrade to
version 2.2. However, version 2.2 is required for non load-based units, LME
units, and for units using certain Part 75 compliance and missing data options.
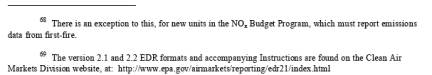
____________________
The quarterly EDR
files must include the following essential information:
•
Facility information;
•
Hourly and cumulative
emissions data;
•
Hourly unit operating
information (e.g., load, heat input rate, operating time, etc.);
•
Monitoring plan
information;
•
Results of required
quality-assurance tests (e.g., daily calibrations, linearity checks, RATAs,
etc.); and
•
Certification
statements from the Designated Representative or Authorized Account
Representative (or the Alternate Representative), attesting to the completeness
and accuracy of the data.
The data from each quarterly
report submittal are recorded and stored in EPA’s Emissions Tracking System
(ETS). The tracking system consists of the previously-mentioned ETS-FTP
software and data checking routines, housed in an EPA mainframe computer. All
sources must obtain an account and a password from EPA in order to submit their
EDR files. The success of the cap and trade programs depends vitally on ETS. It
instills confidence in allowance transactions by certifying the existence and
quantity of the commodity being traded.
EPA recommends that
sources pre-screen their EDR data before making an official submittal. ETS has
a test region where quarterly reports can be sent to receive a preliminary
feedback report. Also, EPA has developed the Monitoring Data Checking (MDC) software,
which is available to all via the Internet70. EPA uses MDC to
perform routine electronic audits of the quarterly reports (see Sections 10.2
and 10.3, and Figure 5, below).
![]()
_____________________
10.2 How does EPA
evaluate the electronic quarterly reports?
Each quarter, EPA
reviews and evaluates the EDR reports, using the following four-step review
process:
•
Data Review - The quarterly reports are analyzed using two software
tools: ETS and MDC. The ETS software recalculates the reported emissions from
the raw data. MDC checks the monitoring plan information, recalculates the
reported QA test results, and determines whether the source is up-to-date on
its important QA tests, such as linearity checks, RATAs, etc. The ETS and MDC
evaluations identify sources with reporting problems and also flag sources that
have not submitted their EDRs by the reporting deadline.
•
Feedback to Sources
- EPA provides feedback to the
sources, based on the results of the ETS and MDC evaluations. The feedback
reports indicate that either:
Ø The data have been accepted and will be stored in the
EPA mainframe for the purposes of annual reconciliation and dissemination; or
Ø The EDR is unacceptable, and contains “critical”
errors that prevent the data from being used for allowance accounting and
dissemination; or
Ø The data have been accepted, but EPA has identified
“non-critical” (informational) errors that must be corrected in subsequent
quarterly reports.
•
Data Resubmission - EPA requires reports with critical errors to be resubmitted
by a specified deadline (generally within 30 days).
•
Data Dissemination - All data are reviewed, and preliminary and final
emissions data reports are prepared for public release and compliance
determination.
When emissions data
are reported in a standardized electronic format such as the EDR, regulatory
agencies can develop software tools with which to audit the data. The results
of these electronic audits can serve as a basis for targeting problem sources, either
for more comprehensive electronic audits or for field audits. In the Part 75
audit program, both electronic audits and field audits are routinely performed.
In addition to the routine
electronic audits of the Part 75 electronic quarterly reports, using the ETS
and MDC software tools. EPA also occasionally performs special (ad-hoc)
electronic audits to look for other specific data reporting problems (e.g.,
incorrect application of the missing data routines).
EPA has recently
developed an electronic auditing software tool, known as the Targeting Tool for
Field Audits (TTFA). This tool is intended to be used primarily by State
agencies, to assist them in targeting sources for field audits. The TTFA tool
is capable of identifying a variety of CEMS operation and maintenance problems,
such as monitoring systems with an excessive number of failed calibration error
tests or linearity checks, sources with long periods of monitor down time,
monitoring systems with improperly-set span and range values, etc.
EPA relies primarily
on State and local agencies to conduct field audits of Part 75-affected
sources. In many instances, the field audits are integrated with routine source
inspections. The audits encourage good monitoring practices by raising plant
awareness of Part 75 requirements. Field audits generally include the following
activities:
F
i g ure 5. Part 75 data reporting and review process.
•
Pre-audit preparation
(e.g., monitoring plan review, examination of historical EDR data using MDC or
the TTFA targeting tool, etc.);
•
On-site inspection of
the monitoring equipment and system peripherals;
•
Records review;
•
QA test observations;
and
•
Interviews with the
appropriate plant personnel.
EPA has developed a
Field Audit Manual, which is available on the Internet71. The Field Audit Manual details recommended procedures for conducting
field audits of Part 75 CEMS. The Manual includes tools that can be used to
prepare for an audit, techniques that can be used to conduct the on-site
inspections and records review, proper methods for observing QA tests, and
guidelines for preparing a final report. Checklists are also provided that can
be used to ensure that all necessary data is obtained during the audit. EPA has
designed the audit procedures in the Manual so that personnel with varying
levels of experience can use them. Three levels of audits are described
in the Manual:
•
A Level 1 audit,
consisting of on-site inspection of the CEM equipment, records review, and
observation of a daily calibration error test;
•
A Level 2 audit,
including all of the Level 1 activities, plus observation of a linearity check
or RATA; and
•
A Level 3 audit,
including the Level 1 activities, plus a performance test (linearity check or
RATA) conducted by agency personnel.
Any State or local agency
can perform a Level 1 or Level 2 audit, but not all agencies have the necessary
equipment or expertise to conduct the performance test required by the Level 3
audit.
![]()
______________________
10.4 Electronic
Reporting—Update
The Clean Air Markets
Division of EPA has recently initiated an effort to re-engineer its data collection
and processing systems. The goal of this project is to modernize the way in
which the Part 75 electronic data is reported to the Agency. The current
“record type-column” EDR format will be replaced with an “XML” format that
interacts more efficiently with a database structure than does the current
format. Proponents of XML believe that using this format will streamline Part
75 reporting and will make the emissions data more accessible to interested
parties because of the enhanced database management capabilities.
The DAHS vendors will
need to develop the necessary software to generate the electronic reports in
XML format. EPA plans to make a gradual transition from the current EDR
reporting format to XML reporting. The Agency plans for a “beta test” version
of XML to be available by the end of 2006. In 2007, beta testers may opt to use
the XML version for some or all of their official quarterly report submittals.
In 2008, all sources will, at their discretion, be allowed to report either in
the current EDR format or in XML. In 2009, all sources will be required to
report only in the XML format.
Some changes to Part
75 will be needed to close out the old EDR format and to support the new XML
reporting format. EPA plans to propose these rule changes in November, 2005 and
to finalize them by the end of 2006.
Regulatory Update
(CAIR and CAMR Rules)
APPENDIX I: Regulatory Update (CAIR and CAMR
Rules)
On March 10, 2005 and
March 15, 2005, respectively, the EPA Administrator signed two important air
regulations:
Ø The Clean Air Interstate Rule (CAIR); and
Ø The Clean Air Mercury Rule (CAMR)
The CAIR rule, which
was published on May 12, 2005, applies to units that produce electricity for
sale and serve a generator with a nameplate capacity > 25 megawatts. Some 28
States are affected by the regulation, mostly in the eastern half of the United
States. The CAIR rule, which has been codified in 40 CFR Part 96, is a model
regulation for a cap and trade program for SO2 and NOx. The goal of this program, which will begin in 2008, is to achieve
significant reductions in SO2 and NOx mass emissions, far exceeding the reductions that have thus far been
achieved by the Acid Rain and NOx Budget Programs.
The CAIR rule
actually consists of three separate regulations, i.e., one for annual SO2 mass emissions, one for annual NOx mass emissions, and
one for ozone season NOx
mass emissions. Most of the affected
States are subject to all three of these rules, although a few States (MN, GA,
TX) are exempted from the ozone season NOx rule and a handful
of other States (AR, DE, NJ, CT, MA) are subject only to the ozone
season NOx rule. Each affected State is required to submit a SIP
revision to EPA for approval within 18 months of the effective date of the
rule. If a State adopts the model rule (or something close to it) and submits
it as a SIP revision, Agency approval will be automatic.
The CAMR rule, which
was published on May 18, 2005, applies to coal-fired units that produce
electricity for sale and serve a generator with a nameplate capacity > 25
megawatts. This regulation, which is found at Subpart HHHH of 40 CFR Part 60,
is also a model rule for a cap and trade program. The program is designed to
achieve substantial reductions in mercury mass emissions, and is scheduled to
begin in 2009. The CAMR rule is similar to CAIR, in that each State must submit
a SIP revision to EPA within 18 months of the effective date of the rule, and
any State SIP revision that adopts the model rule will be automatically
approved. However, unlike CAIR, which focuses mainly on the eastern U.S., the
CAMR rule is national in its scope and affects all 50 States.
The CAMR regulation
is rather unique, in that it is based on section 111(d) of the Clean Air Act.
In order to justify a section 111(d) rulemaking for a particular category of
existing sources and for a particular pollutant, there must be a New Source
Performance Standards (NSPS) regulation in place for the same source category
and pollutant. However, prior to 2005, there was no NSPS regulation in
existence for mercury emissions from coal-fired power plants. Therefore, on May
18, 2005, a mercury NSPS rule (which had been proposed on January 30, 2004) was
published along with the CAMR regulation. The mercury NSPS rule provisions have
been codified as amendments to Subpart Da of 40 CFR Part 60. The mercury NSPS
applies to coal-fired electric generating units that have a heat input capacity
> 250 mmBtu/hr and that commence construction after January 1, 2004.
The rule requires mercury emissions to be continuously monitored.
Both the CAIR and
CAMR rules build upon the existing Part 75 infrastructure and require the
emission monitoring and reporting provisions of Part 75 to be implemented. For
SO2 and NOx, the transition to CAIR should
be relatively smooth, because Part 75 monitoring and reporting of SO2 and NOx mass emissions has been successfully implemented
under the Acid Rain and NOx
Budget Programs for many years. Most of
the units affected by CAIR are currently in one or the other (or both) of these
Programs and already have some or all of the required Part 75 monitoring
systems in place.
However,
implementation of the mercury trading program under the CAMR rule will be more
challenging, because continuous mercury monitoring has not been required by any
State or Federal regulation prior to the CAMR rule. In view of this, as part of
the May 18, 2005 final rule package, EPA has added Subpart I to Part 75.
Subpart I serves the same purpose for mercury mass emissions monitoring as
Subpart H of Part 75 does for NOx mass emissions monitoring, in
that it provides the monitoring guidelines for a multi-state trading program.
The May 18, 2005 final rule has also added specific mercury monitoring
provisions to Part 75, in support of Subpart I. These new mercury monitoring
provisions apply only to units that are regulated under a State or Federal
mercury mass emissions reduction program that adopts Subpart I.
EPA is aware that
mercury monitoring technology is still in its infancy and is not nearly as
well-understood or as well-established as SO2 and NOx monitoring technology. However, the results of recent field studies of
mercury monitors have been encouraging, and at the present rate of progress,
mercury monitoring technology is expected to be sufficiently developed by the
time the CAMR rule is implemented.
Part 75 Monitoring Requirements for Common
Stack and Multiple Stack Configurations
The following Table summarizes
the Part 75 monitoring requirements for common stack and multiple stack
configurations, under the Acid Rain, NOx Budget, CAIR and
CAMR trading programs.
Table
II-A: Part 75 Monitoring Requirements for Common Stack
and
Multiple Stack Configurations
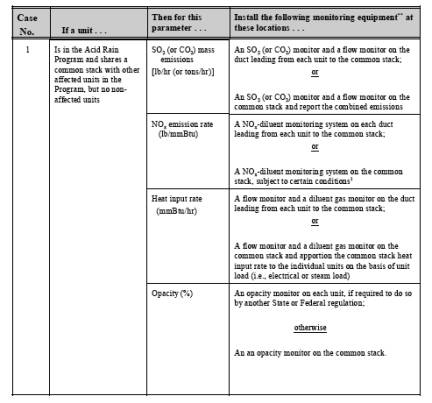
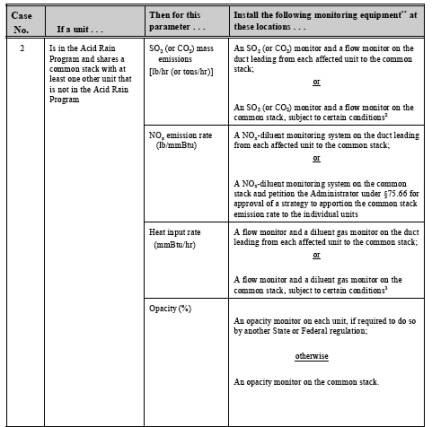
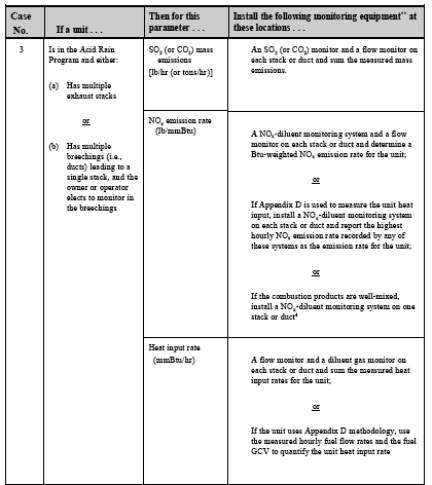
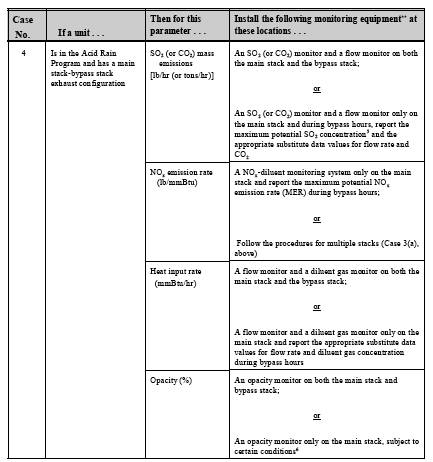
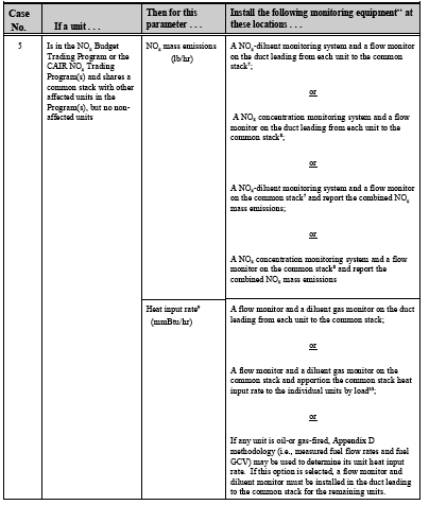
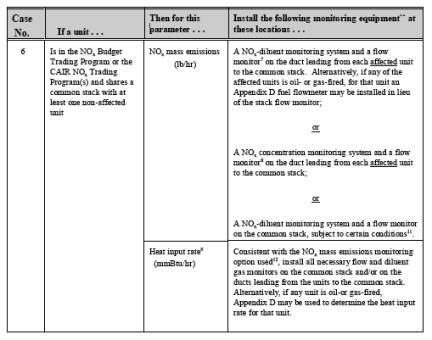
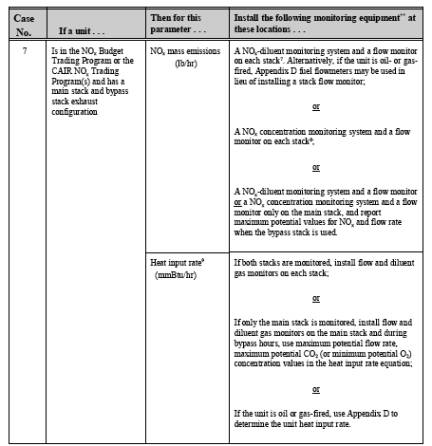
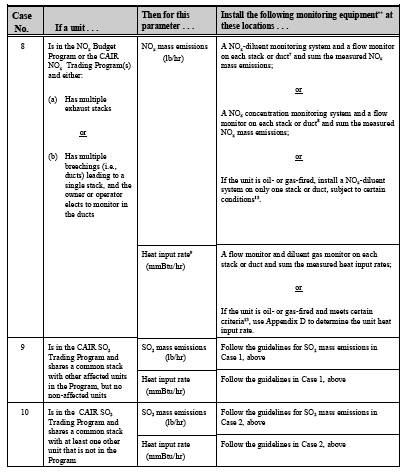
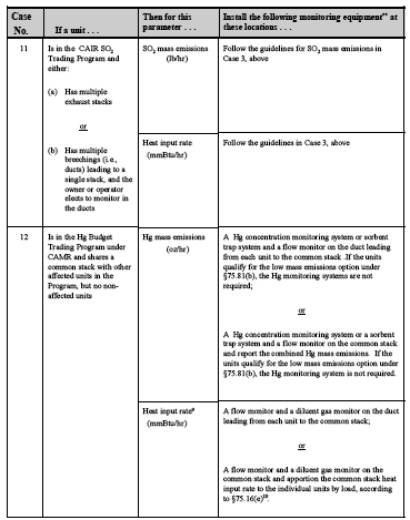
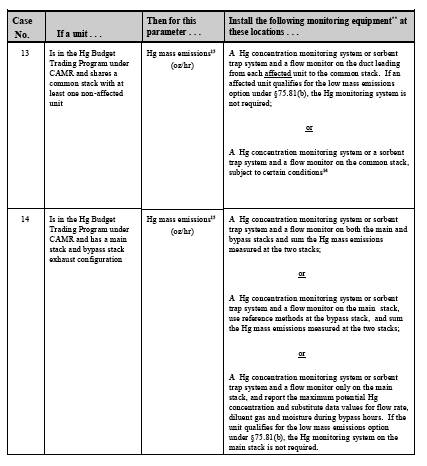
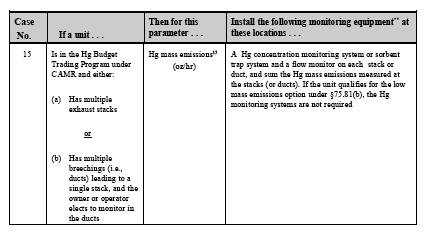
Notes----Table
II-A
**
Although not shown in
Cases 1 through 15 in Table II-A, in some instances, installation of a
continuous moisture monitoring system will also be required. As described in Table
7 in Section 3.4 of this guide, a correction for stack gas moisture is
sometimes required to accurately determine the emissions or heat input rate.
When a correction for moisture is needed, the owner or operator must either use
an approved default moisture value or install a continuous moisture monitoring
system.
1 The compliance options available to
the owner or operator depend on: (a) which (if any) of the units has a Part 76
NOx emission limit; and (b) the
magnitude(s) of any such limit(s).
2 Compliance options include: (a)
opting the non-affected units into the Program; (b) attributing all measured
emissions to the affected units; (c) monitoring the non-affected units and
using a subtractive methodology; and (d) petitioning EPA for approval of an
emission apportionment strategy. The owner or operator must ensure that SO2 or CO2
mass emissions from the
affected unit(s) are not underestimated.
3 The owner or operator has the same
basic compliance options for heat input rate as for SO2 and CO2
mass emissions
accounting (see preceding footnote). Once the combined heat input rate of the
affected units has been quantified, it must be apportioned to the individual
affected units, either on the basis of load or according to a strategy that has
been approved by petition under §75.66.
4 This option may only be used if the
monitored stack or duct cannot be bypassed (e.g., with a damper). The option is
also disallowed if the monitored NOx emission
rate is not representative of the emissions discharged to the atmosphere (e.g.,
if there are additional NOx
emission controls
downstream of the monitored location).
5 Coal-fired Acid Rain Program units
with this configuration have flue gas desulfurization systems (scrubbers) that
reduce SO2 emissions substantially (90% or more,
in most cases). Therefore, during scrubber bypass hours, reporting the maximum
potential SO2 concentration (or, if available, data
from a certified SO2 monitor at the control device inlet)
is appropriate.
6 An opacity monitor is not required on
the bypass stack if: (a) a Federal, State, or local regulation exempts the
bypass stack from opacity monitoring; or (b) An opacity monitor is already
installed at the inlet of the add-on emission controls; or (3) if visible
emissions observations are made using EPA Method 9 during bypass events.
7 These monitoring systems are required
if NOx mass is calculated by multiplying the
NOx emission rate (lb/mmBtu) by the heat
input rate (mmBtu/hr).
8 These monitoring systems are required
of NOx mass is calculated as the product of
NOx concentration (ppm), stack gas flow
rate (scfh), and a conversion factor.
9 If heat input reporting is required
by the regulation.
10 To use this option, all units using
the common stack must have the same F-factor.
11 Available compliance options include:
(a) opting the non-affected units into the Program and reporting the combined
NOx mass emissions; (b) attributing all
of the NOx mass emissions measured at the common
stack to the affected units; (c) installing a NOx -diluent monitoring system and a flow monitor on the duct leading from
each non-affected unit to the common stack, and petitioning to use a
subtractive methodology; or (d) petitioning for approval of a method of
apportioning the NOx mass emissions measured at the common
stack to the individual units.
12 Depending on the compliance option
used, heat input rate determinations may be necessary at the common stack, in
the ductwork to the affected units, in the ductwork of the non-affected units,
or some combination of these.
13 The conditions are: (a) Appendix D
must be used to determine the heat input rate; (b) the combustion products must
be well-mixed; (c) it must be impossible to bypass the monitored stack or duct
(e.g., with dampers); and (d) there must be no NOx emission controls downstream of the monitored location.
14 The available compliance options
include: (a) attribute all of the Hg mass emissions measured at the common stack
to the affected unit(s); (b) install a Hg concentration monitoring system or
sorbent trap system and a flow monitor on the duct leading from each non-affected
unit to the common stack and petition to use a subtractive methodology for Hg
mass (note: if a non-affected unit qualifies for the low mass emissions
option under §75.81(b), the Hg monitoring system is not required); or (c)
petition to use a method of apportioning the Hg mass measured at the common
stack to the individual units
15 Subpart I of Part 75 does not
directly address heat input rate monitoring for this case. However, the
provisions of §75.16(e), which are required under Case 12 seem appropriate for
this case, also.
On-Going QA Test Requirements for
Ozone Season-Only Reporters
The following Table
summarizes the on-going QA test requirements for sources that: (1) are in the
NOx Budget Program or in the CAIR Ozone Season Trading
Program; and (2) are eligible to report NOx mass emissions data
only during the ozone season, rather than year-round; and (3) elect to use this
option:
Table
III-A: On-Going QA Test Requirements
for
Ozone Season-Only Reporters
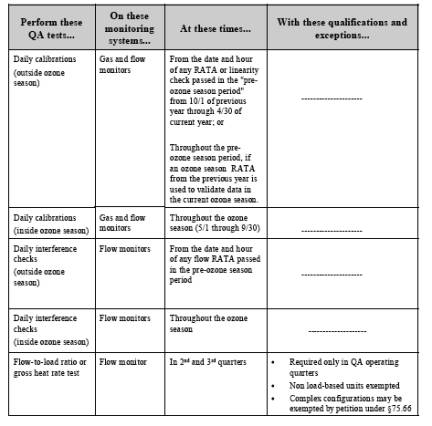
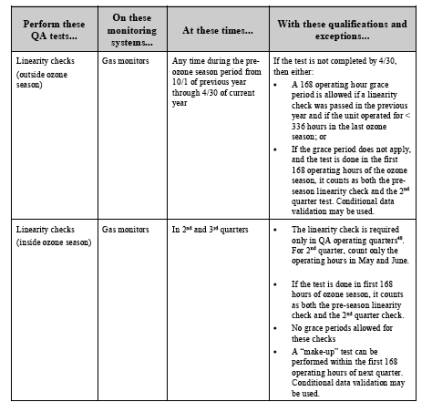
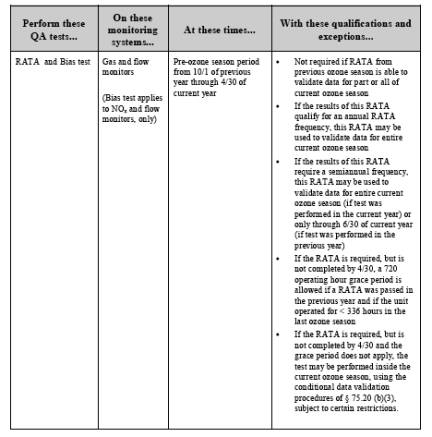
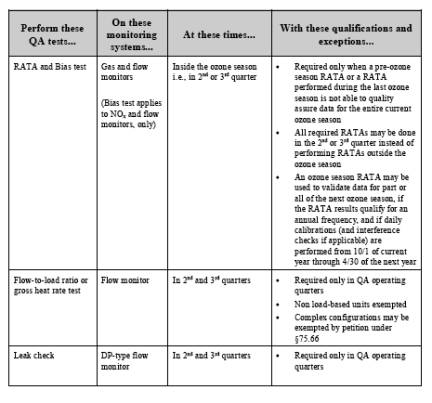
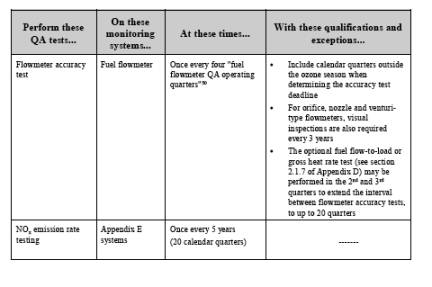
References
The following underlined
section numbers in bold print refer
to sections of this guide. The relevant rule citations for each section of the
document are listed beneath the section number. All referenced rule sections
are from Volume 40 of the Code of Federal Regulations.
Section 1
•
§§60.4101 through
60.4176 (i.e., the CAMR rule)
•
§72.6
•
§§75.1 through 75.84
and Appendices A through K (i.e., the Part 75 rule)
•
§§76.5, 76.6, 76.7, and
76.13
•
§§ 96.1 through 96.88,
and associated SIP regulations (i.e., the NOx Budget Trading
Program)
•
§§96.101 through 96.188
(blueprint for CAIR NOx annual trading program)
•
§§96.201 through 96.288
(blueprint for CAIR SO2 annual trading program)
•
§§96.301 through 96.388
(blueprint for CAIR NOx ozone season trading program)
Section 2.1
•
§§60.4110 through
60.4114
•
§72.2
•
§§72.20 through 72.25
•
§96.2
•
§§96.10 through 96.14
•
§§96.110 through 96.114
•
§§96.210 through 96.214
•
§§96.310 through 96.314
Section 2.2
•
§72.2
•
§§75.10 through 75.18
•
§75.19
•
§§75.40 through 75.48
(Subpart E)
•
§75.66
•
§§75.81 (a) and (b)
•
Appendices D, E and G
to Part 75
Section 2.3
•
§§75.20
•
§75.61(a)(1)
•
§75.62
Section 2.4
•
§72.2
•
§§75.10 through 75.19
•
§75.20
•
§§75.30 through 75.39
•
§§75.81 (a) and (b)
•
Appendices D, E and G
to Part 75
Section 2.5
•
§75.19(c)(1)(iv)(D)
•
§§1, 2.1 through 2.4,
and 2.6 of Part 75, Appendix B
•
§§ 2.1.6 and 2.1.7 of
Part 75, Appendix D
•
§ 2.2 of Part 75,
Appendix E
•
Appendix K to Part 75
Section 2.6
•
§60.4174
•
§75.53
•
§§75.57 through 75.59
•
§75.73
•
§75.84
•
§§96.74, 96.174,
96.274, and 96.374
Section 2.7
•
§60.4174
•
§§75.60 through 75.64
•
§75.73(f)
•
§§96.74, 96.174,
96.274, and 96.374
Section 3.1
•
§72.2
•
§§75.10 through 75.18
•
§75.20(d)
Section 3.2
•
§72.2
•
§75.15
•
Appendix K to Part 75
Section 3.4
•
§75.10(d)
Section 3.5
•
Part 75, Appendix
F—Equations
•
Method 19 in Appendix
A-7 to Part 60
Section 3.6
•
§75.11(b)
•
§75.12(b)
•
§75.66
•
Part 75, Appendix
F—Equations
•
Method 19 in Appendix
A-7 to Part 60
Section 3.7
•
§§75.16 through 75.18
•
§75.72
•
§75.82
Section 3.8
•
§§75.30 through 75.39
Section 4.1
•
§72.2
Section 4.2
•
§§2.1, 2.2 and 2.3 of
Part 75, Appendix D
Section 4.3
•
§2.1 of Part 75,
Appendix D
Section 4.4
•
§§2.2 and 2.3 of Part
75, Appendix D
Section 4.5
•
§§3.1, 3.2 and 3.3 of
Part 75, Appendix D
Section 4.6
•
§3.4 of Part 75,
Appendix D
Section 4.7
•
Table D-4 in §2.2 of
Part 75, Appendix D
•
Table D-5 in §2.3 of
Part 75, Appendix D
•
§§2.3.5, 2.3.6, and
2.3.7 of Part 75, Appendix D
Section 4.8
•
§72.2
•
§1.3 of Part 75,
Appendix B
•
§§2.1.6 and 2.1.7of
Part 75, Appendix D
Section 4.9
•
§2.4 of Part 75,
Appendix D
Sections 5.0 and 5.1
•
§72.2
•
§75.74(c)(11)
•
§§2.1 and 3.4 of Part
75, Appendix D
Section 5.2
•
§2.1 of Part 75,
Appendix E
Section 5.3
•
§2.4 of Part 75,
Appendix E
Section 5.4
•
Table D-4 in §2.2 of
Part 75, Appendix D
•
Table D-5 in §2.3 of
Part 75, Appendix D
Section 5.5
•
§1.3 of Part 75, Appendix
B
•
§§2.2 and 2.3 of Part
75, Appendix E
Section 5.6
•
§2.5 of Part 75,
Appendix E
Section 5.7
•
§1.1 of Part 75,
Appendix E
Section 6.1
•
§72.2
•
§75.19
Section 6.1.1
•
§72.2
•
§75.19(a)(1)
Section 6.1.2
•
§§75.19(a)(2) through
(a)(4)
•
§75.20(h)
Section 6.1.3
•
§§75.19(c)(1), (c)(3),
and (c)(4)
Section 6.1.4
•
§75.19(c)(1)(iv)
Section 6.1.5
•
§75.19(c)(1)(iv)(C)
Section 6.1.6
•
§§75.19(c)(2), (d) and
(e)
Section 6.1.7
•
§75.19(e)
Section 6.1.8
•
§§75.19(b)(2) and
(b)(3)
Section 6.2
•
§§60.4101 through 60.4176
•
§§75.80 through 75.84
Section 7.2
•
§60.4174(b)
•
§75.53
•
§75.62
•
§§75.73(c) and (e)
•
§75.84(e)
Section 7.3
•
§60.4173
•
§75.61(a)(1)
•
§§96.73, 173, 273, and
373
Section 7.4
•
§60.4171
•
§§75.20(c), (e) and (g)
•
§75.70(d)
•
§75.80(d)
•
§§96.71, 171, 271, and
371
Section 7.5
•
§§60.4171(c)(3) and
60.4174(c)
•
§75.20(a)(2)
•
§75.63
•
§75.70(d)
•
§75.80(d)
•
§§96.71, 171, 271, and
371
Section 7.6
•
§60.4171(c)(3)
•
§75.20(a)(4)
•
§75.70(d)
•
§75.80(d)
•
§§96.71, 171, 271, and
371
Section 7.7
•
Appendices A-1 through
A-7 to Part 60
•
§75.22
•
§§5 and 6.5.10 of Part
75, Appendix A
Section 7.8
•
§3 of Part 75, Appendix
A
•
§2.1.5 of Part 75,
Appendix D
Section 7.9
•
§§2.1 through 2.1.7 of
Part 75, Appendix A
•
§§2.2.2.1, 5.2, 6.2,
6.3.1, and 6.3.2 of Part 75, Appendix A
•
§§2.1.1 and 2.1.4 of
Part 75, Appendix B
Section 7.10
•
§60.4171
•
§75.20(b)
•
§75.70(d)
•
§75.80(d)
•
§§96.71, 171, 271, and
371
Sections 8.1 and 8.2
•
§75.21
•
§§75.74(c)(2) through
(c)(5)
•
§§2.1 through 2.4 and
2.6 of Part 75, Appendix B
•
§§ 2.1.6 and 2.1.7 of
Part 75, Appendix D
•
§§2.2 and 2.3 of Part
75, Appendix E
•
Appendix K to Part 75
Section 8.3
•
§6.2 of Part 75,
Appendix A
•
§§2.2 and 2.3 of Part
75, Appendix B
•
§§2.1.6 and 2.1.7 of
Part 75, Appendix D
Section 8.4
•
§§ 6.2, 6.3.1, 6.3.2,
6.5(b), 6.5.1, 6.5.2, 6.5.2.1, and 7.7 of Part 75, Appendix A
•
§§2.1.1, 2.1.1.1,
2.1.1.2, 2.1.5, 2.2.5, and 2.3.1.3 of Part 75, Appendix B
Section 8.5
•
§§75.74(c)(2) through
(c)(5)
Section 8.6
•
§§3.2 and 3.3 of Part
75, Appendix A
•
§§ 2.1.4 and 2.2.5(b)
of Part 75, Appendix B
•
Figure 2 in Appendix B
to Part 75
Section 8.7
•
§75.61(a)(5)
Section 8.8
•
§75.19(e)
•
§§1.1 through 1.3 and
1.5 of Part 75, Appendix B
Section 9
•
§75.20(b)(3)
•
§§75.31 through 75.39
•
§75.70(f)
•
§75.74(c)(7)
•
§75.80(f)
•
§2.4 of Part 75,
Appendix D
•
§2.5 of Part 75,
Appendix E
•
§5 of Part 75, Appendix
G
Section 10
•
§60.4174
•
§§75.60 through 75.64
•
§75.73(f)
•
§75.84
•
§§96.74, 174, 274, and
374