Safety
Integrity
Quality-Value-Profit
Team
90 People
Communication & News
Company Direction
Energy & Environment
Help
Team
90 Processes
Team 90
Projects
Quality
Innovation
Partnershipping
|
|
The charts thumbnails shown below are NOT the the lastest
versions.
But, each month a new chart is automatically created.
You need to
click on a chart to see the most recent.
|
Chart 1
x-y Scatter
Profit vs. Sales
Click to Enlarge
It only changes once a year.
|
|
Chart - 2
Click for Current
1998 to Present |
|
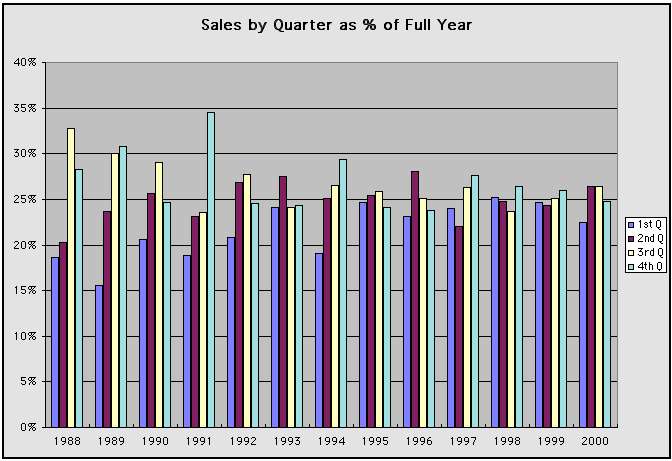
Chart - 3
Click for Current
1988 to Present |
|
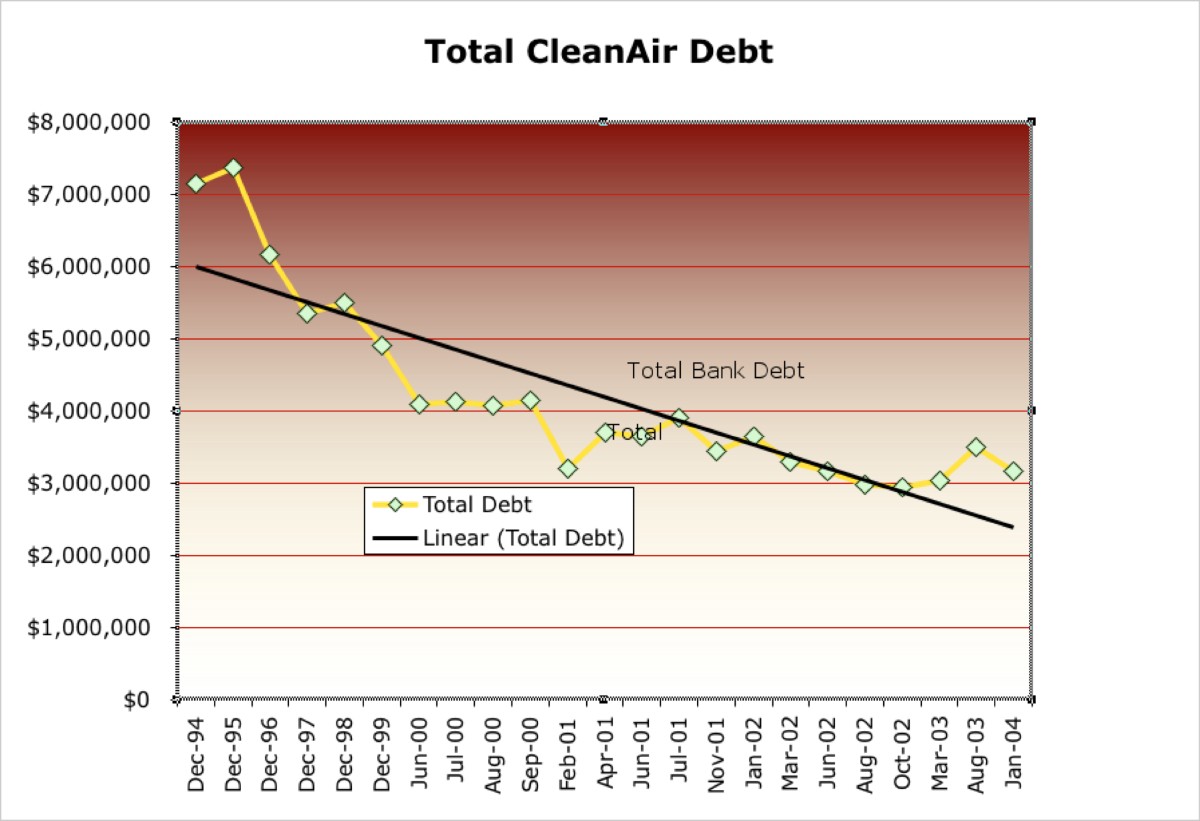
Chart - 4
Click for
1994 to Present |
|
Chart - 5
Click for
1988 to Present |
|
Chart 6 |
|
Chart 7
PvsS_xy_scatter |
|
Chart 8
P_SPC_New |
|
Chart 9
Quarter_SPC |
|
Chart 10
PC_15+yrs |
|
Chart 11
Sales_Growth. |
|
Chart 12
24month_qtr_SPC |
|
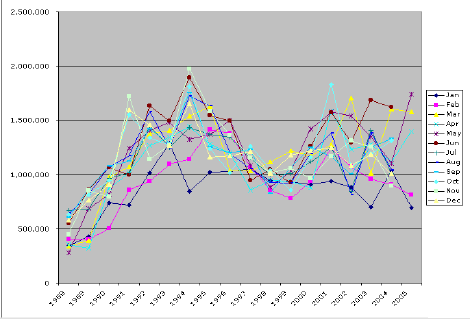
Chart 13
Winter Months |
|
14 |
|
15 |
|
16 |
|
17 |
|
18 |
|
19 |
|
20 |
|
21 |
|
22 |
|
23 |
|
24 |
|
Chart 25
Share Price |
|
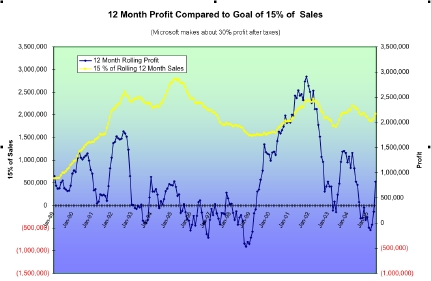
Chart 26
Profit and Goal |
|
Chart 27
Month to Month |
Note: after saving Current FINANCIAL WORKBK delete:
if (window.name!="frSheet")
window.location.replace("::Current FINANCIAL WORKBK.htm");
else
from all charts in Current FINANCIAL WORKBK_files using Dreamweaver
find and replace. |
|
|
|