Method 318 -
Extractive FTIR Method for the Measurement of
Emissions from the
Mineral Wool and Wool Fiberglass Industries
APPENDIX
A TO PART 63--TEST METHOD
1.3 Method Range and Sensitivity.
4.1 Analytical (or
Spectral) Interferences.
4.2 Sampling System
Interferences.
8.0 Sample Collection,
Preservation, and Storage.
8.1 Pretest
Preparations and Evaluations.
8.2 Sampling System
Leak-check.
8.3 Analytical System
Leak-check.
8.5 Pre-Test Calibration
Transfer Standard.
8.7 Sampling QA, Data
Storage and Reporting.
10.0 Calibration and
Standardization.
10.1 Signal-to-Noise
Ratio (S/N).
12.0 Data Analysis and
Calculations.
13.0 Reporting and
Recordkeeping.
15.0 Pollution
Prevention. [Reserved]
1.0 Scope and Application.
This method has been
validated and approved for mineral wool and wool fiberglass sources. This
method may not be applied to other source categories without validation and
approval by the Administrator according to the procedures in Test Method 301,
40 CFR Part 63, Appendix A. For sources seeking to apply FTIR to other source
categories, Test Method 320 (40 CFR Part 63, Appendix A) may be utilized.
1.1 Scope.
The analytes measured
by this method and their CAS numbers are:
Carbon Monoxide
630-08-0
Carbonyl Sulfide
463-58-1
Formaldehyde 50-00-0
Methanol 1455-13-6
Phenol 108-95-2
1.2 Applicability.
1.2.1 This method is
applicable for the determination of formaldehyde, phenol, methanol, carbonyl
sulfide (COS) and carbon monoxide (CO) concentrations in controlled and
uncontrolled emissions from manufacturing processes using phenolic resins. The
compounds are analyzed in the mid-infrared spectral region (about 400 to 4000
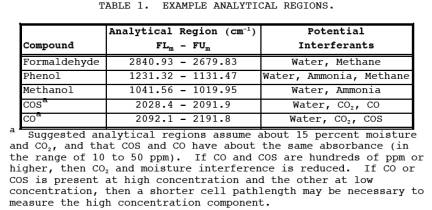
cm-1 or 25 to 2.5 Fm). Suggested analytical regions
are given below (Table 1). Slight deviations from these recommended regions may
be necessary due to variations in moisture content and ammonia concentration
from source to source.
1.2.2 This method
does not apply when: (a) polymerization of formaldehyde occurs, (b) moisture
condenses in either the sampling system or the instrumentation, and (c) when
moisture content of the gas stream is so high relative to the analyte
concentrations that it causes severe spectral interference.
1.3 Method Range and Sensitivity.
1.3.1 The analytical
range is a function of instrumental design and composition of the gas stream.
Theoretical detection limits depend, in part, on (a) the absorption coefficient
of the compound in the analytical frequency region, (b) the spectral
resolution, (c) interferometer sampling time, (d) detector sensitivity and
response, and (e) absorption path-length.
1.3.2 Practically,
there is no upper limit to the range. The practical lower detection limit is
usually higher than the theoretical value, and depends on (a) moisture content
of the flue gas, (b) presence of interferants, and (c) losses in the sampling
system. In general, a 22 meter path-length cell in a suitable sampling system
can achieve practical detection limits of 1.5 ppm for three compounds
(formaldehyde, phenol, and methanol) at moisture levels up to 15 percent by
volume. Sources with uncontrolled emissions of CO and COS may require a 4 meter
path-length cell due to high concentration levels. For these two compounds,
make sure absorbance of highest concentration component is <1.0.
1.4 Data Quality Objectives.
1.4.1 In designing or
configuring the system, the analyst first sets the data quality objectives,
i.e., the desired lower detection limit (DLi) and the
desired analytical uncertainty (AUi) for each
compound. The instrumental parameters (factors b, c, d, and e in Section 1.3.1)
are then chosen to meet these requirements, using Appendix D of the FTIR
Protocol.
1.4.2 Data quality
for each application is determined, in part, by measuring the RMS (Root Mean
Square) noise level in each analytical spectral region (Appendix C of the FTIR
Protocol). The RMS noise is
defined as the RMSD (Root Mean Square Deviation) of the absorbance values in an
analytical region from the mean absorbance value of the region. Appendix D of
the FTIR Protocol defines
the MAUim (minimum analyte uncertainty of the ith analyte in the mth analytical
region). The MAU is the minimum analyte concentration for which the analytical
uncertainty limit (AUi) can be maintained: if the measured analyte
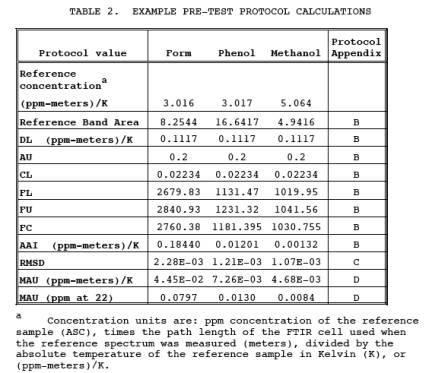
concentration is less than MAUi, then data quality is
unacceptable. Table 2 gives some
2.0 Summary of Method.
2.1 Principle.
2.1.1 Molecules are
composed of chemically bonded atoms, which are in constant motion. The atomic
motions result in bond deformations (bond stretching and bond-angle bending).
The number of fundamental (or independent) vibrational motions depends on the
number of atoms (N) in the molecule. At typical testing temperatures, most
molecules are in the ground-state vibrational state for most of their
fundamental vibrational motions. A molecule can undergo a transition from its
ground state (for a particular vibration) to the first excited state by
absorbing a quantum of light at a frequency characteristic of the molecule and
the molecular motion. Molecules also undergo rotational transitions by
absorbing energies in the far-infrared or microwave spectral regions.
Rotational transition absorbencies are superimposed on the vibrational
absorbencies to give a characteristic shape to each rotational-vibrational
absorbance "band."
2.1.2 Most molecules
exhibit more than one absorbance band in several frequency regions to produce
an infrared spectrum (a characteristic pattern of bands or a
"fingerprint") that is unique to each molecule. The infrared spectrum
of a molecule depends on its structure (bond lengths, bond angles, bond
strengths, and atomic masses). Even small differences in structure can produce
significantly different spectra.
2.1.3 Spectral band
intensities vary with the concentration of the absorbing compound. Within
constraints, the relationship between absorbance and sample concentration is
linear. Sample spectra are compared to reference spectra to determine the
species and their concentrations.
2.2 Sampling and Analysis.
2.2.1 Flue gas is
continuously extracted from the source, and the gas or a portion of the gas is
conveyed to the FTIR gas cell, where a spectrum of the flue gas is recorded.
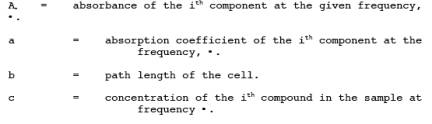
Absorbance band intensities are related to sample concentrations by Beer's Law.
![]()
where:
2.2.2 After identifying
a compound from the infrared spectrum, its concentration is determined by
comparing band intensities in the sample spectrum to band intensities in
"reference spectra" of the formaldehyde, phenol, methanol, COS and
CO. These reference spectra are available in a permanent soft copy from the EPA
spectral library on the EMTIC bulletin board. The source may also prepare
reference spectra according to Section 4.5 of the FTIR Protocol. (Note: Reference spectra not prepared
according to the FTIR Protocol are not acceptable for use in this test method.
Documentation detailing the FTIR Protocol steps used in preparing any non-EPA
reference spectra shall be included in each test report submitted by the
source.)
2.3 Operator Requirements.
The analyst must have
some knowledge of source sampling and of infrared spectral patterns to operate
the sampling system and to choose a suitable instrument configuration. The
analyst should also understand FTIR instrument operation well enough to choose
an instrument configuration consistent with the data quality objectives.
3.0 Definitions.
See Appendix A of the
FTIR Protocol.
4.0 Interferences.
4.1 Analytical (or Spectral) Interferences.
Water vapor. High
concentrations of ammonia (hundreds of ppm) may interfere with the analysis of
low concentrations of methanol (1 to 5 ppm). For CO, carbon dioxide and water
may be interferants. In cases where COS levels are low relative to CO levels,
CO and water may be interferants.
4.2 Sampling System Interferences.
Water, if it condenses,
and ammonia, which reacts with formaldehyde.
5.0 Safety.
5.1 Formaldehyde is a
suspected carcinogen; therefore, exposure to this compound must be limited.
Proper monitoring and safety precautions must be practiced in any atmosphere
with potentially high concentrations of CO.
5.2 This method may
involve sampling at locations having high positive or negative pressures, high
temperatures, elevated heights, high concentrations of hazardous or toxic
pollutants, or other diverse sampling conditions. It is the responsibility of
the tester(s) to ensure proper safety and health practices, and to determine
the applicability of regulatory limitations before performing this test method.
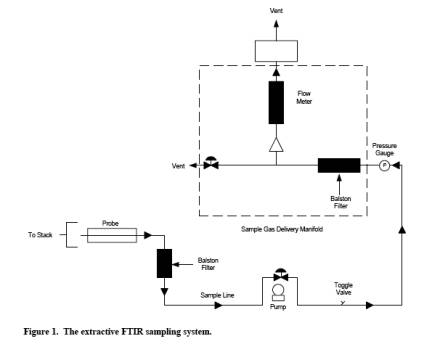
6.0 Equipment and Supplies.
The equipment and
supplies are based on the schematic of a sampling train shown in Figure 1.
Either the evacuated or purged sampling technique may be used with this
sampling train. Alternatives may be used, provided that the data quality
objectives of this method are met.
6.1 Sampling Probe.
Glass, stainless steel, or other appropriate material of sufficient length and
physical integrity to sustain heating, prevent adsorption of analytes, and to
reach gas sampling point.
6.2 Particulate
Filters. A glass wool plug (optional) inserted at the probe tip (for large
particulate removal) and a filter rated at 1-micron (e.g., Balston™) for fine particulate removal, placed immediately after the heated
probe.
6.3 Sampling
Line/Heating System. Heated (maintained at 250 ± 25 degrees F) stainless steel,
TeflonTM, or other inert material that does not adsorb
the analytes, to transport the sample to analytical system.
6.4 Stainless Steel
Tubing. Type 316, e.g., 3/8 in. diameter, and appropriate length for heated
connections.
6.5 Gas Regulators.
Appropriate for individual gas cylinders.
6.6 TeflonTM Tubing. Diameter (e.g., 3/8 in.) and length
suitable to connect cylinder regulators.
6.7 Sample Pump. A
leak-free pump (e.g., KNF™), with by-pass valve, capable of pulling sample
through entire sampling system at a rate of about 10 to 20 L/min. If placed
before the analytical system, heat the pump and use a pump fabricated from
materials non-reactive to the target pollutants. If the pump is located after
the instrument, systematically record the sample pressure in the gas cell.
6.8 Gas Sample
Manifold. A heated manifold that diverts part of the sample stream to the
analyzer, and the rest to the by-pass discharge vent or other analytical
instrumentation.
6.9 Rotameter. A
calibrated 0 to 20 L/min range rotameter.
6.10 FTIR Analytical
System. Spectrometer and detector, capable of measuring formaldehyde, phenol,
methanol, COS and CO to the predetermined minimum detectable level. The system
shall include a personal computer with compatible software that provides
real-time updates of the spectral profile during sample collection and spectral
collection.
6.11 FTIR Cell Pump.
Required for the evacuated sampling technique, capable of evacuating the FTIR
cell volume within 2 minutes. The FTIR cell pump should allow the operator to
obtain at least 8 sample spectra in 1 hour.
6.12 Absolute
Pressure Gauge. Heatable and capable of measuring pressure from 0 to 1000 mmHg
to within ±2.5 mmHg (e.g., Baratron™).
6.13 Temperature
Gauge. Capable of measuring the cell temperature to within ±2°C.
7.0 Reagents and Standards.
7.1 Ethylene
(Calibration Transfer Standard). Obtain NIST traceable (or Protocol) cylinder
gas.
7.2 Nitrogen. Ultra
high purity (UHP) grade.
7.3 Reference
Spectra. Obtain reference spectra for the target pollutants at concentrations
that bracket (in ppm-meter/K) the emission source levels. Also, obtain
reference spectra for SF6
and ethylene. Suitable
concentrations are 0.0112 to 0.112 (ppm-meter)/K for SF6 and 5.61 (ppm-meter)/K or less for ethylene. The reference spectra
shall meet the criteria for acceptance outlined in Section 2.2.2. The optical
density (ppm-meters/K) of the reference spectrum must match the optical density
of the sample spectrum within (less than) 25 percent.
8.0 Sample Collection, Preservation, and Storage.
Sampling should be
performed in the following sequence: Collect background, collect CTS spectrum,
collect samples, collect post-test CTS spectrum, verify that two copies of all
data were stored on separate computer media.
8.1 Pretest Preparations and Evaluations.
Using the procedure
in Section 4.0 of the FTIR Protocol,
determine the optimum sampling system configuration for sampling the target
pollutants. Table 2 gives some example values for AU, DL, and MAU. Based on a
study (Reference 1), an FTIR system using 1 cm-1 resolution,
22 meter path length, and a broad band MCT detector was suitable for meeting
the requirements in Table 2. Other factors that must be determined are:
a. Test requirements:
AUi, CMAXi, DLi, OFUi, and tAN for
each.
b. Inteferants: See
Table 1.
c. Sampling system: LS', Pmin, PS', TS', tSS, VSS;
fractional error, MIL.
d. Analytical
regions: 1 through Nm, FLm, FCm, and FUm, plus interferants, FFUm, FFLm, wave number range FNU to FNL. See Tables 1 and
2.
8.1.1 If necessary,
sample and acquire an initial spectrum. Then determine the proper operational
path-length of the instrument to obtain non-saturated absorbances of the target
analytes.
8.1.2 Set up the
sampling train as shown in Figure 1.
8.2 Sampling System Leak-check.
Leak-check from the
probe tip to pump outlet as follows: Connect a 0- to 250-mL/min rate meter
(rotameter or bubble meter) to the outlet of the pump. Close off the inlet to
the probe, and note the leakage rate. The leakage rate shall be < 200
mL/min.
8.3 Analytical System Leak-check.
8.3.1 For the
evacuated sample technique, close the valve to the FTIR cell, and evacuate the
absorption cell to the minimum absolute pressure Pmin. Close the valve to the pump, and determine the
change in pressure •Pv
after 2 minutes.
8.3.2 For both the
evacuated sample and purging techniques, pressurize the system to about 100
mmHg above atmospheric pressure. Isolate the pump and determine the change in
pressure •Pp after 2 minutes.
8.3.3 Measure the
barometric pressure, Pb
in mmHg.
8.3.4 Determine the
percent leak volume %VL
for the signal integration time tSS and for •Pmax, i.e.,
the larger of •Pv or •Pp, as
follows:
![]()
where:
50 = 100% divided by
the leak-check time of 2 minutes.
8.3.5 Leak volumes in
excess of 4 percent of the sample system volume VSS are
unacceptable.
8.4 Background Spectrum.
Evacuate the gas cell
to <5 mmHg, and fill with dry nitrogen gas to ambient pressure.
Verify that no significant amounts of absorbing species (for example water
vapor and CO2) are present. Collect a background spectrum,
using a signal averaging period equal to or greater than the averaging period
for the sample spectra. Assign a unique file name to the background spectrum.
Store the spectra of the background interferogram and processed single-beam
background spectrum on two separate computer media (one is used as the backup).
If continuous sampling will be used during sample collection, collect the
background spectrum with nitrogen gas flowing through the cell at the same
pressure and temperature as will be used during sampling.
8.5 Pre-Test Calibration Transfer Standard.
Evacuate the gas cell
to <5 mmHg absolute pressure, and fill the FTIR cell to atmospheric
pressure with the CTS gas. Or, purge the cell with 10 cell volumes of CTS gas.
Record the spectrum. If continuous sampling will be used during sample
collection, collect the CTS spectrum with CTS gas flowing through the cell at
the same pressure and temperature as will be used during sampling.
8.6 Samples.
8.6.1 Evacuated Samples.
Evacuate the
absorbance cell to <5 mmHg absolute pressure. Fill the cell with flue
gas to ambient pressure and record the spectrum. Before taking the next sample,
evacuate the cell until no further evidence of absorption exists. Repeat this
procedure to collect at least 8 separate spectra (samples) in 1 hour.
8.6.2 Purge Sampling.
Purge the FTIR cell
with 10 cell volumes of flue gas and at least for about 10 minutes. Discontinue
the gas cell purge, isolate the cell, and record the sample spectrum and the
pressure. Before taking the next sample, purge the cell with 10 cell volumes of
flue gas.
8.6.3 Continuous Sampling.
Spectra can be
collected continuously while the FTIR cell is being purged. The sample
integration time, tss, the sample flow rate through the FTIR gas
cell, and the total run time must be chosen so that the collected data consist
of at least 10 spectra with each spectrum being of a separate cell volume of
flue gas. More spectra can be collected over the run time and the total run
time (and number of spectra) can be extended as well.
8.7 Sampling QA, Data Storage and Reporting.
8.7.1 Sample
integration times should be sufficient to achieve the required signal-to-noise
ratios. Obtain an absorbance spectrum by filling the cell with nitrogen.
Measure the RMSD in each analytical region in this absorbance spectrum. Verify
that the number of scans is sufficient to achieve the target MAU (Table 2).
8.7.2 Identify all
sample spectra with unique file names.
8.7.3 Store on two
separate computer media a copy of sample interferograms and processed spectra.
The data shall be available to the Administrator on request for the length of
time specified in the applicable regulation.
8.7.4 For each sample
spectrum, document the sampling conditions, the sampling time (while the cell
was being filled), the time the spectrum was recorded, the instrumental
conditions (path length, temperature, pressure, resolution, integration time),
and the spectral file name. Keep a hard copy of these data sheets.
8.8 Signal Transmittance.
While sampling,
monitor the signal transmittance through the instrumental system. If signal
transmittance (relative to the background) drops below 95 percent in any
spectral region where the sample does not absorb infrared energy, obtain a new
background spectrum.
8.9 Post-run CTS.
After each sampling
run, record another CTS spectrum.
8.10 Post-test QA.
8.10.1 Inspect the
sample spectra immediately after the run to verify that the gas matrix
composition was close to the expected (assumed) gas matrix.
8.10.2 Verify that
the sampling and instrumental parameters were appropriate for the conditions
encountered. For example, if the moisture is much greater than anticipated, it
will be necessary to use a shorter path length or dilute the sample.
8.10.3 Compare the
pre- and post-run CTS spectra. They shall agree to within ±5 percent. See FTIR
Protocol, Appendix E.
9.0 Quality Control.
Follow the quality
assurance procedures in the method, including the analysis of pre- and post-run
calibration transfer standards (Sections 8.5 and 8.9) and the post-test quality
assurance procedures in Section 8.10.
10.0 Calibration and Standardization.
10.1 Signal-to-Noise Ratio (S/N).
The S/N shall be
sufficient to meet the MAU in each analytical region.
10.2 Absorbance Path-length.
Verify the absorbance
path length by comparing CTS spectra to reference spectra of the calibration
gas(es). See FTIR Protocol,
Appendix E.
10.3 Instrument Resolution.
Measure the line
width of appropriate CTS band(s) and compare to reference CTS spectra to verify
instrumental resolution.
10.4 Apodization Function.
Choose appropriate
apodization function. Determine any appropriate mathematical transformations
that are required to correct instrumental errors by measuring the CTS. Any
mathematical transformations must be documented and reproducible.
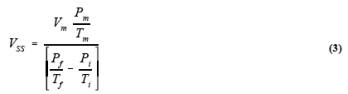
10.5 FTIR Cell Volume.
Evacuate the cell to <5
mmHg. Measure the initial absolute temperature (Ti)
and absolute pressure (Pi). Connect a wet test meter (or a calibrated dry
gas meter), and slowly draw room air into the cell. Measure the meter volume (Vm), meter absolute temperature (Tm), and
meter absolute pressure (Pm), and the cell final absolute temperature (Tf) and absolute pressure (Pf).
Calculate the FTIR cell volume VSS, including that of
the connecting tubing, as follows:
As an alternative to
the wet test meter/calibrated dry gas meter procedure, measure the inside
dimensions of the cell cylinder and calculate its volume.
11.0 Procedure.
Refer to Sections 4.6
- 4.11, Sections 5, 6, and 7, and the appendices of the FTIR Protocol.
12.0 Data Analysis and Calculations.
a. Data analysis is
performed using appropriate reference spectra whose concentrations can be
verified using CTS spectra. Various analytical programs are available to relate
sample absorbance to a concentration standard. Calculated concentrations should
be verified by analyzing spectral baselines after mathematically subtracting
scaled reference spectra from the sample spectra. A full description of the
data analysis and calculations may be found in the FTIR Protocol (Sections 4.0, 5.0, 6.0 and appendices).
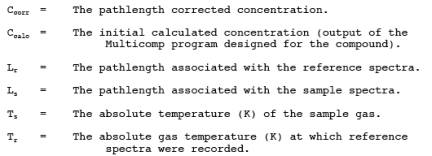
b. Correct the
calculated concentrations in sample spectra for differences in absorption
path-length between the reference and sample spectra by:
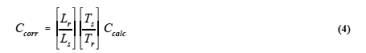
where:
13.0 Reporting and Recordkeeping.
All interferograms
used in determining source concentration shall be stored for the period of time
required in the applicable regulation. The Administrator has the option of
requesting the interferograms recorded during the test in electronic form as
part of the test report.
14.0 Method Performance.
Refer to the FTIR
Protocol.
15.0 Pollution Prevention. [Reserved]
16.0 Waste Management.
Laboratory standards
prepared from the formaldehyde and phenol are handled according to the
instructions in the materials safety data sheets (MSDS).
17.0 References.
(1) "Field
Validation Test Using Fourier Transform Infrared (FTIR) Spectrometry To Measure
Formaldehyde, Phenol and Methanol at a Wool Fiberglass Production
Facility." Draft. U.S. Environmental Protection Agency Report, Entropy,
Inc., EPA Contract No. 68D20163, Work Assignment I-32, December 1994 (docket
item II-A-13).
(2) "Method 301
- Field Validation of Pollutant Measurement Methods from Various Waste
Media," 40 CFR part 63, appendix A.