METHOD
101 - DETERMINATION OF PARTICULATE AND GASEOUS MERCURY EMISSIONS FROM
CHLOR-ALKALI PLANTS (AIR STREAMS)
NOTE: This method does not include all of the
specifications (e.g.,
equipment and supplies) and procedures (e.g., sampling and analytical) essential to its
performance. Some material is incorporated by reference from methods in
Appendix A to 40 CFR Part 60. Therefore, to obtain reliable results, persons
using this method should have a thorough knowledge of at least the following
additional test methods: Method 1, Method 2, Method 3, and Method 5.
5.2.1 Hydrochloric Acid
(HCl).
6.3 Sample Preparation
and Analysis.
7.2 Sample Preparation
and Analysis.
8.0 Sample Collection,
Preservation, Transport, and Storage.
8.2 Preliminary
Determinations.
8.3 Preparation of
Sampling Train.
8.6 Calculation of
Percent Isokinetic.
10.0 Calibration and
Standardizations.
10.3 Aeration System
Flow Rate Meter.
10.4 Optical Cell
Heating System.
10.5 Spectrophotometer
and Recorder.
11.4 Container No. 2
(Silica Gel).
12.0 Data Analysis and
Calculations.
14.0 Pollution
Prevention. [Reserved]
15.0 Waste Management.
[Reserved]
17.0 Tables, Diagrams,
Flowcharts, and Validation Data.
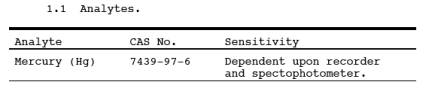
1.0 Scope and Application.
1.1 Analytes.
1.2 Applicability.
This method is
applicable for the determination of Hg emissions, including both particulate
and gaseous Hg, from chlor-alkali plants and other sources (as specified in the
regulations) where the carrier-gas stream in the duct or stack is principally
air.
1.3 Data Quality Objectives.
Adherence to the
requirements of this method will enhance the quality of the data obtained from
air pollutant sampling methods.
2.0 Summary of Method.
Particulate and
gaseous Hg emissions are withdrawn isokinetically from the source and collected
in acidic iodine monochloride (ICl) solution. The Hg collected (in the mercuric
form) is reduced to elemental Hg, which is then aerated from the solution into
an optical cell and measured by atomic absorption spectrophotometry.
3.0 Definitions. [Reserved]
4.0 Interferences.
4.1 Sample Collection.
Sulfur dioxide (SO2) reduces ICl and causes premature depletion of the ICl solution.
4.2 Sample Analysis.
4.2.1 ICl
concentrations greater than 10-4 molar inhibit the
reduction of the Hg (II) ion in the aeration cell.
4.2.2 Condensation of
water vapor on the optical cell windows causes a positive interference.
5.0 Safety.
5.1 Disclaimer.
This method may
involve hazardous materials, operations, and equipment. This test method does
not purport to address all of the safety problems associated with its use. It
is the responsibility of the user of this test method to establish appropriate
safety and health practices and determine the applicability of regulatory
limitations prior to performing this test method.
5.2 Corrosive Reagents.
The following
reagents are hazardous. Personal protective equipment and safe procedures are
useful in preventing chemical splashes. If contact occurs, immediately flush
with copious amounts of water for at least 15 minutes. Remove clothing under
shower and decontaminate. Treat residual chemical burn as thermal burn.
5.2.1 Hydrochloric Acid (HCl).
Highly toxic and
corrosive. Causes severe damage to tissues. Vapors are highly irritating to
eyes, skin, nose, and lungs, causing severe damage. May cause bronchitis,
pneumonia, or edema of lungs. Exposure to concentrations of 0.13 to 0.2 percent
can be lethal to humans in a few minutes. Provide ventilation to limit
exposure. Reacts with metals, producing hydrogen gas.
5.2.2 Nitric Acid (HNO3).
Highly corrosive to
eyes, skin, nose, and lungs. Vapors cause bronchitis, pneumonia, or edema of
lungs. Reaction to inhalation may be delayed as long as 30 hours and still be
fatal. Provide ventilation to limit exposure. Strong oxidizer. Hazardous
reaction may occur with organic materials such as solvents.
5.2.3 Sulfuric Acid (H2SO4).
Rapidly destructive
to body tissue. Will cause third degree burns. Eye damage may result in
blindness. Inhalation may be fatal from spasm of the larynx, usually within 30
minutes. 3 mg/m3 will cause lung damage. 1 mg/m3 for 8 hours will cause lung damage or, in higher concentrations,
death. Provide ventilation to limit inhalation. Reacts violently with metals
and organics.
6.0 Equipment and Supplies.
6.1 Sample Collection.
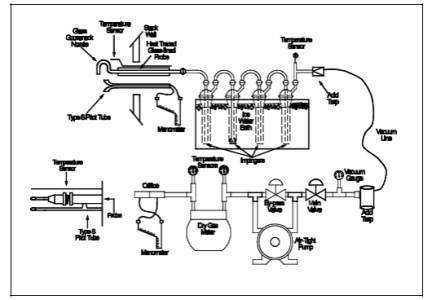
A schematic of the
sampling train used in performing this method is shown in
Figure 101-1; it is similar to the Method 5 sampling train. The following
items are required for sample collection:
6.1.1 Probe Nozzle,
Pitot Tube, Differential Pressure Gauge, Metering System, Barometer, and Gas
Density Determination Equipment. Same as Method 5, Sections 6.1.1.1, 6.1.1.3,
6.1.1.4, 6.1.1.9, 6.1.2, and 6.1.3, respectively.
6.1.2 Probe Liner.
Borosilicate or quartz glass tubing. A heating system capable of maintaining a
gas temperature of 120 ± 14 ºC (248 ± 25 ºF) at the probe exit during sampling
may be used to prevent water condensation.
NOTE: Do not use metal probe liners.
6.1.3 Impingers. Four
Greenburg-Smith impingers connected in series with leak-free ground glass
fittings or any similar leak-free non-contaminating fittings. For the
first, third, and
fourth impingers, impingers that are modified by replacing the tip with a 13-mm
ID (0.5-in.) glass tube extending to 13 mm (0.5 in.) from the bottom of the
flask may be used.
6.1.4 Acid Trap. Mine
Safety Appliances air line filter, Catalog number 81857, with acid absorbing
cartridge and suitable connections, or equivalent.
6.2 Sample Recovery.
The following items
are needed for sample recovery:
6.2.1 Glass Sample
Bottles. Leakless, with Teflon-lined caps, 1000- and 100-ml.
6.2.2 Graduated
Cylinder. 250-ml.
6.2.3 Funnel and
Rubber Policeman. To aid in transfer of silica gel to container; not necessary
if silica gel is weighed in the field.
6.2.4 Funnel. Glass,
to aid in sample recovery.
6.3 Sample Preparation and Analysis.
The following items
are needed for sample preparation and analysis:
6.3.1 Atomic
Absorption Spectrophotometer. Perkin-Elmer 303, or equivalent, containing a
hollow-cathode mercury lamp and the optical cell described in Section 6.3.2.
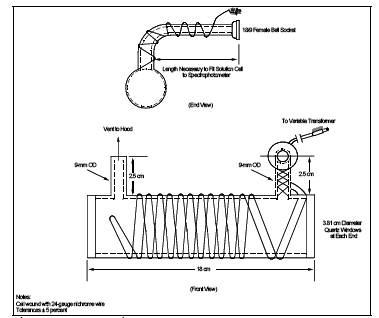
6.3.2 Optical Cell.
Cylindrical shape with quartz end windows and having the dimensions shown in Figure 101-2. Wind the cell with approximately 2 meters (6
ft) of 24-gauge Nichrome wire, or equivalent, and wrap with fiberglass
insulation tape, or equivalent; do not let the wires touch each other.
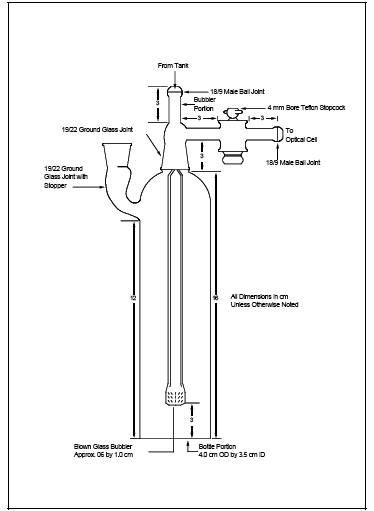
6.3.3 Aeration Cell.
Constructed according to the specifications in Figure 101-3.
Do not use a glass frit as a substitute for the blown glass bubbler tip shown
in Figure 101-3.
6.3.4 Recorder. Matched
to output of the spectrophotometer described in Section 6.3.1.
6.3.5 Variable
Transformer. To vary the voltage on the optical cell from 0 to 40 volts.
6.3.6 Hood. For
venting optical cell exhaust.
6.3.7 Flow Metering
Valve.
6.3.8 Rate Meter. Rotameter,
or equivalent, capable of measuring to within 2 percent a gas flow of 1.5
liters/min (0.053 cfm).
6.3.9 Aeration Gas
Cylinder. Nitrogen or dry, Hg-free air, equipped with a single-stage regulator.
6.3.10 Tubing. For
making connections. Use glass tubing (ungreased ball and socket connections are
recommended) for all tubing connections between the solution cell and the
optical cell; do not use Tygon tubing, other types of flexible tubing, or metal
tubing as substitutes. Teflon, steel, or copper tubing may be used between the
nitrogen tank and flow metering valve (Section 6.3.7), and Tygon, gum, or
rubber tubing between the flow metering valve and the aeration cell.
6.3.11 Flow Rate
Calibration Equipment. Bubble flow meter or wet-test meter for measuring a gas
flow rate of 1.5 ± 0.1 liters/min (0.053 ± 0.0035 cfm).
6.3.12 Volumetric
Flasks. Class A with penny head standard taper stoppers; 100-, 250-, 500-, and
1000-ml.
6.3.13 Volumetric
Pipets. Class A; 1-, 2-, 3-, 4-, and 5-ml.
6.3.14 Graduated Cylinder.
50-ml.
6.3.15 Magnetic
Stirrer. General-purpose laboratory type.
6.3.16 Magnetic
Stirring Bar. Teflon-coated.
6.3.17 Balance.
Capable of weighing to ± 0.5 g
6.3.18 Alternative Analytical
Apparatus. Alternative systems are allowable as long as they meet the following
criteria:
6.3.18.1 A linear
calibration curve is generated and two consecutive samples of the same aliquot
size and concentration agree within 3 percent of their average.
6.3.18.2 A minimum of
95 percent of the spike is recovered when an aliquot of a source sample is
spiked with a known concentration of Hg (II) compound.
6.3.18.3 The reducing
agent should be added after the aeration cell is closed.
6.3.18.4 The aeration
bottle bubbler should not contain a frit.
6.3.18.5 Any Tygon
tubing used should be as short as possible and conditioned prior to use until
blanks and standards yield linear and reproducible results.
6.3.18.6 If manual
stirring is done before aeration, it should be done with the aeration cell
closed.
6.3.18.7 A drying
tube should not be used unless it is conditioned as the Tygon tubing above.
7.0 Reagents and Standards.
Unless otherwise
indicated, all reagents must conform to the specifications established by the
Committee on Analytical Reagents of the American Chemical Society; where such
specifications are not available, use the best available grade.
7.1 Sample Collection.
The following
reagents are required for sample collection:
7.1.1 Water.
Deionized distilled, to conform to ASTM D 1193-77 or 91 (incorporated by
reference - see § 61.18), Type 1. If high concentrations of organic matter are
not expected to be present, the analyst may eliminate the KMnO4 test for oxidizable organic matter. Use this water in all dilutions
and solution preparations.
7.1.2 Nitric Acid, 50
Percent (v/v). Mix equal volumes of concentrated HNO3 and water, being careful to add the acid to the water slowly.
7.1.3 Silica Gel.
Indicating type, 6- to 16-mesh. If previously used, dry at 175 ºC (350 ºF) for
2 hours. The tester may use new silica gel as received.
7.1.4 Potassium
Iodide (KI) Solution, 25 Percent. Dissolve 250 g of KI in water, and dilute to
1 liter.
7.1.5 Iodine Monochloride
Stock Solution, 1.0 M. To 800 ml of 25 percent KI solution, add 800 ml of
concentrated HCl. Cool to room temperature. With vigorous stirring, slowly add
135 g of potassium iodate (KIO3), and stir until all
free iodine has dissolved. A clear orange-red solution occurs when all the KIO3 has been added. Cool to room temperature, and dilute to 1800 ml
with water. Keep the solution in amber glass bottles to prevent degradation.
7.1.6 Absorbing
Solution, 0.1 M ICl. Dilute 100 ml of the 1.0 M ICl stock solution to 1 liter
with water. Keep the solution in amber glass bottles and in darkness to prevent
degradation. This reagent is stable for at least two months.
7.2 Sample Preparation and Analysis.
The following
reagents and standards are required for sample preparation and analysis:
7.2.1 Reagents
7.2.1.1 Tin (II)
Solution. Prepare fresh daily, and keep sealed when not being used. Completely
dissolve 20 g of tin (II) chloride [or 25 g of tin (II) sulfate] crystals
(Baker Analyzed reagent grade or any other brand that will give a clear
solution) in 25 ml of concentrated HCl. Dilute to 250 ml with water. Do not
substitute HNO3, H2SO4, or other strong acids for the HCl.
7.2.1.2 Sulfuric
Acid, 5 Percent (v/v). Dilute 25 ml of concentrated H2SO4 to 500 ml with water.
7.2.2 Standards
7.2.2.1 Hg Stock
Solution, 1 mg Hg/ml. Prepare and store all Hg standard solutions in
borosilicate glass containers. Completely dissolve 0.1354 g of Hg (II) chloride
in 75 ml of water in a 100-ml glass volumetric flask. Add 10 ml of concentrated
HNO3, and adjust the volume to exactly 100 ml with
water. Mix thoroughly. This solution is stable for at least one month.
7.2.2.2 Intermediate
Hg Standard Solution, 10 µg Hg/ml. Prepare fresh weekly. Pipet 5.0 ml of the Hg
stock solution (Section 7.2.2.1) into a 500-ml glass volumetric flask, and add
20 ml of the 5 percent H2SO4 solution.
Dilute to exactly 500 ml with water. Thoroughly mix the solution.
7.2.2.3 Working Hg
Standard Solution, 200 ng Hg/ml. Prepare fresh daily. Pipet 5.0 ml of the
intermediate Hg standard solution (Section 7.2.2.2) into a 250-ml volumetric
glass flask. Add 10 ml of the 5 percent H2SO4 and 2 ml of the 0.1 M ICl absorbing solution taken as a blank (Section 8.7.4.3), and dilute to 250 ml with water.
Mix thoroughly.
8.0 Sample Collection, Preservation, Transport, and
Storage.
Because of the
complexity of this method, testers should be trained and experienced with the
test procedures to ensure reliable results. Since the amount of Hg that is
collected generally is small, the method must be carefully applied to prevent
contamination or loss of sample.
8.1 Pretest Preparation.
Follow the general
procedure outlined in Method 5, Section 8.1,
except omit Sections 8.1.2 and 8.1.3.
8.2 Preliminary Determinations.
Follow the general
procedure outlined in Method 5, Section 8.2,
with the exception of the following:
8.2.1 Select a nozzle
size based on the range of velocity heads to assure that it is not necessary to
change the nozzle size in order to maintain isokinetic sampling rates below 28
liters/min (1.0 cfm).
8.2.2 Perform test
runs such that samples are obtained over a period or periods that accurately
determine the maximum emissions that occur in a 24-hour period. In the case of
cyclic operations, run sufficient tests for the accurate determination of the
emissions that occur over the duration of the cycle. A minimum sample time of 2
hours is recommended. In some instances, high Hg or high SO2 concentrations make it impossible to sample for the desired minimum
time. This is indicated by reddening (liberation of free iodine) in the first
impinger. In these cases, the sample run may be divided into two or more
sub-runs to ensure that the absorbing solution is not depleted.
8.3 Preparation of Sampling Train.
8.3.1 Clean all
glassware (probe, impingers, and connectors) by rinsing with 50 percent HNO3, tap water, 0.1 M ICl, tap water, and finally deionized distilled
water. Place 100 ml of 0.1 M ICl in each of the first three impingers. Take
care to prevent the absorbing solution from contacting any greased surfaces.
Place approximately 200 g of pre-weighed silica gel in the fourth impinger.
More silica gel may be used, but care should be taken to ensure that it is not
entrained and carried out from the impinger during sampling. Place the silica
gel container in a clean place for later use in the sample recovery.
Alternatively, determine and record the weight of the silica gel plus impinger
to the nearest 0.5 g.
8.3.2 Install the
selected nozzle using a Viton A O-ring when stack temperatures are less than
260 ºC (500 ºF). Use a fiberglass string gasket if temperatures are higher. See
APTD-0576 (Reference 3 in Method 5) for
details. Other connecting systems using either 316 stainless steel or Teflon
ferrules may be used. Mark the probe with heat-resistant tape or by some other
method to denote the proper distance into the stack or duct for each sampling
point.
8.3.3 Assemble the
train as shown in Figure 101-1, using (if necessary) a very light coat of
silicone grease on all ground glass joints. Grease only the outer portion (see
APTD-0576) to avoid the possibility of contamination by the silicone grease.
NOTE: An empty impinger may be inserted between the
third impinger and the silica gel to remove excess moisture from the sample
stream.
8.3.4 After the
sampling train has been assembled, turn on and set the probe heating system, if
applicable, at the desired operating temperature. Allow time for the
temperatures to stabilize. Place crushed ice around the impingers.
8.4 Leak-Check Procedures.
Follow the leak-check
procedures outlined in Method 5, Section 8.4.
8.5 Sampling Train Operation.
Follow the general
procedure outlined in Method 5, Section 8.5.
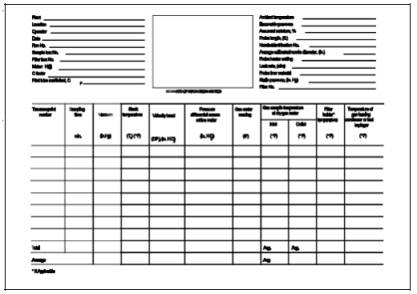
For each run, record the data required on a data sheet such as the one shown in
Figure 101-4.
8.6 Calculation of Percent Isokinetic.
Same as Method 5, Section 8.6.
8.7 Sample Recovery.
Begin proper cleanup
procedure as soon as the probe is removed from the stack at the end of the
sampling period.
8.7.1 Allow the probe
to cool. When it can be safely handled, wipe off any external particulate
matter near the tip of the probe nozzle, and place a cap over it. Do not cap
off the probe tip tightly while the sampling train is cooling. Capping would
create a vacuum and draw liquid out from the impingers.
8.7.2 Before moving the
sampling train to the cleanup site, remove the probe from the train, wipe off
the silicone grease, and cap the open outlet of the probe. Be careful not to
lose any condensate that might be present. Wipe off the silicone grease from
the impinger. Use either ground-glass stoppers, plastic caps, or serum caps to
close these openings.
8.7.3 Transfer the
probe and impinger assembly to a cleanup area that is clean, protected from the
wind, and free of Hg contamination. The ambient air in laboratories located in
the immediate vicinity of Hg-using facilities is not normally free of Hg
contamination.
8.7.4 Inspect the
train before and during disassembly, and note any abnormal conditions. Treat
the samples as follows.
8.7.4.1 Container No.
1 (Impingers and Probe).
8.7.4.1.1 Using a
graduated cylinder, measure the liquid in the first three impingers to within 1
ml. Record the volume of liquid present (e.g., see Figure 5-6 of
Method 5). This information is needed to calculate the moisture content of
the effluent gas. (Use only glass storage bottles and graduated cylinders that
have been precleaned as in Section 8.3.1) Place the contents of the first three
impingers into a 1000-ml glass sample bottle.
8.7.4.1.2 Taking care
that dust on the outside of the probe or other exterior surfaces does not get
into the sample, quantitatively recover the Hg (and any condensate) from the
probe nozzle, probe fitting, and probe liner as follows: Rinse these components
with two 50-ml portions of 0.1 M ICl. Next, rinse the probe nozzle, fitting and
liner, and each piece of connecting glassware between the probe liner and the
back half of the third impinger with a maximum of 400 ml of water. Add all washings to the 1000-ml glass
sample bottle containing the liquid from the first three impingers.
8.7.4.1.3 After all
washings have been collected in the sample container, tighten the lid on the
container to prevent leakage during shipment to the laboratory. Mark the height
of the liquid to determine later whether leakage occurred during transport.
Label the container to identify clearly its contents.
8.7.4.2 Container No.
2 (Silica Gel). Same as Method 5, Section
8.7.6.3.
8.7.4.3 Container No. 3 (Absorbing Solution Blank). Place 50 ml of
the 0.1 M ICl absorbing solution in a 100-ml sample bottle. Seal the container.
Use this blank to prepare the working Hg standard solution (Section 7.2.2.3).
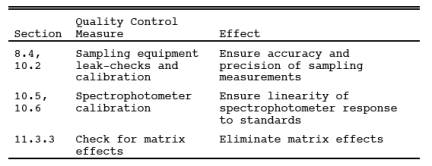
9.0 Quality Control.
9.1 Miscellaneous
Quality Control Measures.
9.2 Volume Metering
System Checks. Same as Method 5, Section 9.2.
10.0 Calibration and Standardizations.
NOTE: Maintain a laboratory log of all calibrations.
10.1 Before Use
Before use, clean all
glassware, both new and used, as follows: brush with soap and tap water,
liberally rinse with tap water, soak for 1 hour in 50 percent HNO3, and then rinse with deionized distilled water.
10.2 Sampling Equipment.
Calibrate the
sampling equipment according to the procedures outlined in the following
sections of Method 5: Section 10.1 (Probe
Nozzle), Section 10.2 (Pitot Tube Assembly), Section 10.3 (Metering System),
Section 10.5 (Temperature Sensors), Section 10.6 (Barometer).
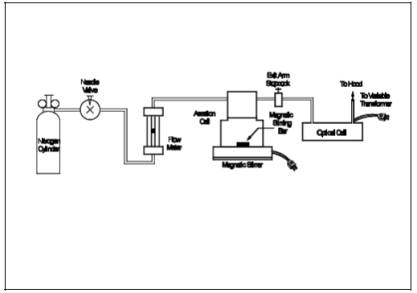
10.3 Aeration System Flow Rate Meter.
Assemble the aeration
system as shown in Figure 101-5. Set the outlet
pressure on the aeration gas cylinder regulator to a minimum pressure of 500 mm
Hg (10 psi), and use the flowmetering valve and a bubble flowmeter or wet-test
meter to obtain a flow rate of 1.5 ± 0.1 liters/min (0.053 ± 0.0035 cfm)
through the aeration cell. After the calibration of the aeration system flow
rate meter is complete, remove the bubble flowmeter from the system.
10.4 Optical Cell Heating System.
Using a 50-ml
graduated cylinder, add 50 ml of water to the bottle section of the aeration
cell, and attach the bottle section to the bubbler section of the cell. Attach
the aeration cell to the optical cell and while aerating at 1.5 ± 0.1
liters/min (0.053 ± 0.0035 cfm), determine the minimum variable transformer
setting necessary to prevent condensation of moisture in the optical cell and
in the connecting tubing. (This setting should not exceed 20 volts.)
10.5 Spectrophotometer and Recorder.
10.5.1 The Hg
response may be measured by either peak height or peak area.
NOTE: The temperature of the solution affects the rate
at which elemental Hg is released from a solution and, consequently, it affects
the shape of the absorption curve (area) and the point of maximum absorbance
(peak height). Therefore, to
obtain reproducible results, bring all solutions to room temperature before
use.
10.5.2 Set the
spectrophotometer wavelength at 253.7 nm, and make certain the optical cell is
at the minimum temperature that will prevent water condensation. Then set the
recorder scale as follows: Using a 50-ml graduated cylinder, add 50 ml of water
to the aeration cell bottle. Add three drops of Antifoam B to the bottle, and
then pipet 5.0 ml of the working Hg standard solution into the aeration cell.
NOTE: Always add the Hg-containing solution to the
aeration cell after the 50 ml of water.
10.5.3 Place a
Teflon-coated stirring bar in the bottle. Before attaching the bottle section
to the bubbler section of the aeration cell, make certain that (1) the aeration
cell exit arm stopcock (Figure 101-3) is closed (so
that Hg will not prematurely enter the optical cell when the reducing agent is
being added) and (2) there is no flow through the bubbler. If conditions (1)
and (2) are met, attach the bottle section to the bubbler section of the
aeration cell. Pipet 5 ml of tin (II) reducing solution into the aeration cell
through the side arm, and immediately stopper the side arm. Stir the solution
for 15 seconds, turn on the recorder, open the aeration cell exit arm stopcock,
and immediately initiate aeration with continued stirring. Determine the
maximum absorbance of the standard, and set this value to read 90 percent of
the recorder full scale.
10.6 Calibration Curve.
10.6.1 After setting
the recorder scale, repeat the procedure in Section 10.5 using 0.0-, 1.0-,
2.0-, 3.0-, 4.0-, and 5.0-ml aliquots of the working standard solution (final
amount of Hg in the aeration cell is 0, 200, 400, 600, 800, and 1000 ng,
respectively). Repeat this procedure on each aliquot size until two consecutive
peaks agree within 3 percent of their average value.
NOTE: To prevent Hg carryover from one sample to
another, do not close the aeration cell from the optical cell until the
recorder pen has returned to the baseline.) 10.6.2 It should not be necessary
to disconnect the aeration gas inlet line from the aeration cell when changing
samples. After separating the bottle and bubbler sections of the aeration cell,
place the bubbler section into a 600-ml beaker containing approximately 400 ml
of water. Rinse the bottle section of the aeration cell with a stream of water
to remove all traces of the tin (II) reducing agent. Also, to prevent the loss
of Hg before aeration, remove all traces of the reducing agent between samples
by washing with water. It will be necessary, however, to wash the aeration cell
parts with concentrated HCl if any of the following conditions occur: (1) A
white film appears on any inside surface of the aeration cell, (2) the
calibration curve changes suddenly, or (3) the replicate samples do not yield
reproducible results.
10.6.3 Subtract the
average peak height (or peak area) of the blank (0.0-ml aliquot) - which must
be less than 2 percent of recorder full scale - from the averaged peak heights
of the 1.0-, 2.0-, 3.0-, 4.0-, and 5.0-ml aliquot standards. If the blank
absorbance is greater than 2 percent of full-scale, the probable cause is Hg
contamination of a reagent or carry-over of Hg from a previous sample. Prepare
the calibration curve by plotting the corrected peak height of each standard
solution versus the corresponding final total Hg weight in the aeration cell
(in ng), and draw the best fit straight line. This line should either pass
through the origin or pass through a point no further from the origin than ± 2
percent of the recorder full scale. If the line does not pass through or very
near to the origin, check for nonlinearity of the curve and for incorrectly
prepared standards.
11.0 Analytical Procedure.
11.1 Sample Loss Check.
Check the liquid
level in each container to see whether liquid was lost during transport. If a
noticeable amount of leakage occurred, either void the sample or use methods
subject to the approval of the Administrator to account for the losses.
11.2 Sample Preparation.
Treat each sample as
follows:
11.2.1 Container No.
1 (Impingers and Probe). Carefully transfer the contents of Container No. 1
into a 1000-ml volumetric flask, and adjust the volume to exactly 1000 ml with
water.
11.2.2 Dilutions. Pipet
a 2-ml aliquot from the diluted sample from Section 11.2.1 into a 250-ml
volumetric flask. Add 10 ml of 5 percent H2SO4, and adjust the volume to exactly 250 ml with water. This solution
is stable for at least 72 hours.
NOTE: The dilution factor will be 250/2 for this
solution.
11.3 Analysis.
Calibrate the
analytical equipment and develop a calibration curve as outlined in Sections
10.3 through 10.6.
11.3.1 Mercury
Samples. Repeat the procedure used to establish the calibration curve with an
appropriately sized aliquot (1 to 5 ml) of the diluted sample (from Section
11.2.2) until two consecutive peak heights agree within 3 percent of their
average value. The peak maximum of an aliquot (except the 5-ml aliquot) must be
greater than 10 percent of the recorder full scale. If the peak maximum of a
1.0-ml aliquot is off scale on the recorder, further dilute the original source
sample to bring the Hg concentration into the calibration range of the
spectrophotometer.
11.3.2 Run a blank
and standard at least after every five samples to check the spectrophotometer
calibration. The peak height of the blank must pass through a point no further
from the origin than ±2 percent of the recorder full scale. The difference
between the measured concentration of the standard (the product of the
corrected peak height and the reciprocal of the least squares slope) and the
actual concentration of the standard must be less than 7 percent, or
recalibration of the analyzer is required.
11.3.3
Check for Matrix Effects (optional). Use the Method of Standard Additions as
follows to check at least one sample from each source for matrix effects on the
Hg results. The Method of Standard Additions procedures described on pages 9-4
and 9-5 of the section entitled "General Information" of the Perkin
Elmer Corporation Atomic Absorption Spectrophotometry Manual, Number 303-0152
(Reference 16 in Section 16.0) are recommended. If the results of the Method of
Standard Additions procedure used on the single source sample do not agree to
within ±5 percent of the value obtained by the routine atomic absorption
analysis, then reanalyze all samples from the source using the Method of
Standard Additions procedure.
11.4 Container No. 2 (Silica Gel).
Weigh the spent
silica gel (or silica gel plus impinger) to the nearest 0.5 g using a balance.
(This step may be conducted in the field.)
12.0 Data Analysis and Calculations.
Carry out
calculations, retaining at least one extra decimal significant figure beyond
that of the acquired data. Round off figures only after the final calculation.
Other forms of the equations may be used as long as they give equivalent
results.
12.1 Average Dry Gas
Meter Temperature and Average Orifice Pressure Drop, Dry Gas Volume, Volume of
Water Vapor Condensed, Moisture Content, and Isokinetic Variation. Same as Method 5, Sections 12.2 through 12.5 and 12.11,
respectively.
12.2 Stack Gas
Velocity. Using the data from this test and Equation
2-9 of Method 2, calculate the average stack gas velocity vs.
12.3.1 For each
source sample, correct the average maximum absorbance of the two consecutive
samples whose peak heights agree within 3 percent of their average for the
contribution of the solution blank (see Section 10.6.3). Use the calibration
curve and these corrected averages to determine the final total weight of Hg in
ng in the aeration cell for each source sample.
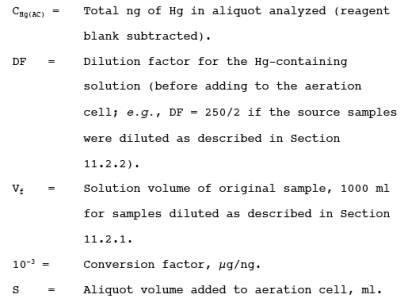
12.3.2 Correct for
any dilutions made to bring the sample into the working range of the
spectrophotometer. Then calculate the Hg in the original solution, mHg, as follows:
![]()
where:
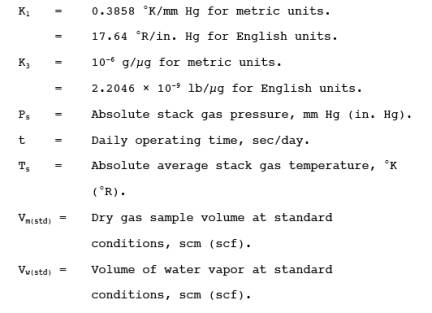
12.4 Mercury Emission
Rate. Calculate the daily Hg emission rate, R, using Equation 101-2. For
continuous operations, the operating time is equal to 86,400 seconds per day.
For cyclic operations, use only the time per day each stack is in operation.
The total Hg emission rate from a source will be the summation of results from
all stacks.
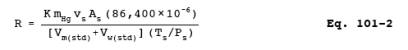
where:
12.5 Determination of
Compliance. Each performance test consists of three repetitions of the
applicable test method. For the purpose of determining compliance with an
applicable national emission standard, use the average of the results of all
repetitions.
13.0 Method Performance.
The following
estimates are based on collaborative tests, wherein 13 laboratories performed
duplicate analyses on two Hg-containing samples from a chlor-alkali plant and
on one laboratory-prepared sample of known Hg concentration. The sample concentrations
ranged from 2 to 65 µg Hg/ml.
13.1 Precision. The
estimated intra-laboratory and inter-laboratory standard deviations are 1.6 and
1.8 µg Hg/ml, respectively.
13.2 Accuracy. The participating
laboratories that analyzed a 64.3 µg Hg/ml (in 0.1 M ICl) standard obtained a
mean of 63.7 µg Hg/ml.
13.3 Analytical
Range. After initial dilution, the range of this method is 0.5 to 120 µg Hg/ml.
The upper limit can be extended by further dilution of the sample.
14.0 Pollution Prevention. [Reserved]
15.0 Waste Management. [Reserved]
16.0 References.
Same as Method 5, Section 17.0, References 1-3, 5, and 6,
with the addition of the following:
1. Determining Dust
Concentration in a Gas Stream. ASME Performance Test Code No. 27. New York, NY.
1957.
2. DeVorkin, Howard,
et al. Air Pollution Source Testing Manual. Air Pollution Control District. Los
Angeles, CA. November 1963.
3. Hatch, W.R., and
W.I. Ott. Determination of Sub-Microgram Quantities of Mercury by Atomic
Absorption Spectrophotometry. Anal. Chem. 40:2085-87. 1968.
4. Mark, L.S.
Mechanical Engineers' Handbook. McGraw-Hill Book Co., Inc. New York, NY. 1951.
5. Western
Precipitation Division of Joy Manufacturing Co. Methods for Determination of
Velocity, Volume, Dust and Mist Content of Gases. Bulletin WP-50. Los Angeles,
CA. 1968.
6. Perry, J.H.
Chemical Engineers' Handbook. McGraw-Hill Book Co., Inc. New York, NY. 1960.
7. Shigehara, R.T.,
W.F. Todd, and W.S. Smith. Significance of Errors in Stack Sampling
Measurements. Stack Sampling News. 1(3):6-18. September 1973.
8. Smith, W.S., R.T.
Shigehara, and W.F. Todd. A Method of Interpreting Stack Sampling Data. Stack
Sampling News. 1(2):8-17. August 1973.
9. Standard Method
for Sampling Stacks for Particulate Matter. In: 1971 Annual Book of ASTM
Standards, Part 23. ASTM Designation D 2928-71. Philadelphia, PA 1971.
10. Vennard, J.K. Elementary
Fluid Mechanics. John Wiley and Sons, Inc. New York. 1947.
11. Mitchell, W.J.
and M.R. Midgett. Improved Procedure for Determining Mercury Emissions from
Mercury Cell Chlor-Alkali Plants. J. APCA. 26:674-677. July 1976.
12. Shigehara, R.T.
Adjustments in the EPA Nomograph for Different Pitot Tube Coefficients and Dry
Molecular Weights. Stack Sampling News. 2:4-11. October 1974.
13. Vollaro, R.F.
Recommended Procedure for Sample Traverses in Ducts Smaller than 12 Inches in
Diameter. U.S. Environmental Protection Agency, Emission Measurement Branch.
Research Triangle Park, NC. November 1976.
14. Klein, R. and C.
Hach. Standard Additions: Uses and Limitation in Spectrophotometric
Measurements. Amer. Lab. 9:21. 1977.
15. Perkin Elmer
Corporation. Analytical Methods for Atomic Absorption Spectrophotometry.
Norwalk, Connecticut. September 1976.
17.0 Tables, Diagrams, Flowcharts, and Validation Data.
Figure
101-1. Mercury Sampling Train.
Figure
101-4. Mercury Field Data.
Figure
101-5. Schematic of Aeration System.