Method 6C - Determination of Sulfur Dioxide Emissions from Stationary Sources (Instrumental Analyzer Procedure)
1.
APPLICABILITY AND PRINCIPLE
3.4 Analyzer
Calibration Error.
4. MEASUREMENT SYSTEM
PERFORMANCE
4.1 Analyzer
Calibration Error.
5.1.4 Calibration Valve
Assembly.
5.1.5 Moisture Removal
System.
5.1.8 Sample Flow Rate
Control.
5.2 Method 6 Apparatus
and Reagents.
6. MEASUREMENT SYSTEM
PERFORMANCE TEST PROCEDURES
6.1 Calibration Gas
Concentration Verification.
6.2 Measurement System
Preparation.
6.3 Analyzer
Calibration Error.
6.4 Sampling System
Bias Check.
7.1 Selection of
Sampling Site and Sampling Points.
7.2 Interference Check
Preparation.
7.4 Zero and
Calibration Drift Tests.
7.5 Interference Check
(if performed).
1. APPLICABILITY AND PRINCIPLE
1.1 Applicability.
This
method is applicable to the determination of sulfur dioxide (SO2) concentrations in controlled and
uncontrolled emissions from stationary sources only when specified within the
regulations.
1.2 Principle.
A gas sample
is continuously extracted from a stack, and a portion of the sample is conveyed
to an instrumental analyzer for determination of SO2 gas concentration using an ultraviolet
(UV), non-dispersive infrared (NDIR), or fluorescence analyzer. Performance
specifications and test procedures are provided to ensure reliable data.
2. RANGE AND SENSITIVITY
2.1 Analytical Range.
The analytical
range is determined by the instrumental design. For this method, a portion of
the analytical range is selected by choosing the span of the monitoring system.
The span of the monitoring system shall be selected such that the pollutant gas
concentration equivalent to the emission standard is not less than 30 percent
of the span. If at any time during a run the measured gas concentration exceeds
the span, the run shall be considered invalid.
2.2 Sensitivity.
The minimum
detectable limit depends on the analytical range, span, and signal-to-noise
ratio of the measurement system. For a well-designed system, the minimum
detectable limit should be less than 2 percent of the span.
3. DEFINITIONS
3.1 Measurement System.
The total
equipment required for the determination of gas concentration. The measurement
system consists of the following major subsystems:
3.1.1 Sample Interface.
That portion
of a system used for one or more of the following: sample acquisition, sample
transport, sample conditioning, or protection of the analyzers from the effects
of the stack effluent.
3.1.2 Gas Analyzer.
That portion
of the system that senses the gas to be measured and generates an output
proportional to its concentration.
3.1.3 Data Recorder.
A strip chart
recorder, analog computer, or digital recorder for recording measurement data
from the analyzer output.
3.2 Span.
The upper
limit of the gas concentration measurement range displayed on the data
recorder.
3.3 Calibration Gas.
A known
concentration of a gas in an appropriate diluent gas.
3.4 Analyzer Calibration Error.
The difference
between the gas concentration exhibited by the gas analyzer and the known
concentration of the calibration gas when the calibration gas is introduced
directly to the analyzer.
3.5 Sampling System Bias.
The difference
between the gas concentrations exhibited by the measurement system when a known
concentration gas is introduced at the outlet of the sampling probe and when
the same gas is introduced directly to the analyzer.
3.6 Zero Drift.
The difference
in the measurement system output reading from the initial calibration response
at the zero concentration level after a stated period of operation during which
no unscheduled maintenance, repair, or adjustment took place.
3.7 Calibration Drift.
The difference
in the measurement system output reading from the initial calibration response
at a mid-range calibration value after a stated period of operation during
which no unscheduled maintenance, repair, or adjustment took place.
3.8 Response Time.
The amount of
time required for the measurement system to display 95 percent of a step change
in gas concentration on the data recorder.
3.9 Interference Check.
A method for
detecting analytical interferences and excessive biases through direct
comparison of gas concentrations provided by the measurement system and by a
modified Method 6 procedure. For this check, the
modified Method 6 samples are acquired at the sample by-pass discharge vent.
3.10 Calibration Curve.
A graph or
other systematic method of establishing the relationship between the analyzer
response and the actual gas concentration introduced to the analyzer.
4. MEASUREMENT SYSTEM PERFORMANCE SPECIFICATIONS
4.1 Analyzer Calibration Error.
Less than ±2
percent of the span for the zero, mid-range, and high-range calibration gases.
4.2 Sampling System Bias.
Less than ±5
percent of the span for the zero and mid-range calibration gases.
4.3 Zero Drift.
Less than ±3
percent of the span over the period of each run.
4.4 Calibration Drift.
Less than ±3
percent of the span over the period of each run.
4.5 Interference Check.
Less than ±7 percent
of the modified Method 6 result for each run.
5. APPARATUS AND REAGENTS
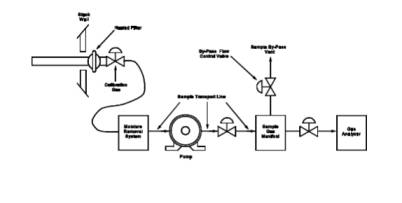
5.1 Measurement System.
Use any
measurement system for SO2 that meets the specifications of this
method. A schematic of an acceptable measurement system is shown in Figure 6C-1. The essential components of the measurement
system are described below:
5.1.1 Sample Probe.
Glass,
stainless steel, or equivalent, of sufficient length to traverse the sample
points. The sampling probe shall be heated to prevent condensation.
5.1.2 Sample Line.
Heated
(sufficient to prevent condensation) stainless steel or Teflon tubing, to
transport the sample gas to the moisture removal system.
5.1.3 Sample Transport Lines.
Stainless
steel or Teflon tubing, to transport the sample from the moisture removal
system to the sample pump, sample flow rate control, and sample gas manifold.
5.1.4 Calibration Valve Assembly.
A three-way
valve assembly, or equivalent, for blocking the sample gas flow and introducing
calibration gases to the measurement system at the outlet of the sampling probe
when in the calibration mode.
5.1.5 Moisture Removal System.
A
refrigerator-type condenser or similar device (e.g., permeation dryer), to
remove condensate continuously from the sample gas while maintaining minimal
contact between the condensate and the sample gas. The moisture removal system
is not necessary for analyzers that can measure gas concentrations on a wet
basis; for these analyzers, (1) heat the sample line and all interface
components up to the inlet of the analyzer sufficiently to prevent
condensation, and (2) determine the moisture content and correct the measured
gas concentrations to a dry basis using appropriate methods, subject to the
approval of the Administrator. The determination of sample moisture content is
not necessary for pollutant analyzers that measure concentrations on a wet
basis when (1) a wet basis CO2
analyzer operated according to Method 3A is used
to obtain simultaneous measurements, and (2) the pollutant/CO2 measurements are used to determine
emissions in units of the standard.
5.1.6 Particulate Filter.
An in-stack or
heated (sufficient to prevent water condensation) out-of-stack filter. The
filter shall be borosilicate or quartz glass wool, or glass fiber mat.
Additional filters at the inlet or outlet of the moisture removal system and
inlet of the analyzer may be used to prevent accumulation of particulate
material in the measurement system and extend the useful life of the
components. All filters shall be fabricated of materials that are nonreactive
to the gas being sampled.
5.1.7 Sample Pump.
A leak-free
pump, to pull the sample gas through the system at a flow rate sufficient to
minimize the response time of the measurement system. The pump may be
constructed of any material that is nonreactive to the gas being sampled.
5.1.8 Sample Flow Rate Control.
A sample flow
rate control valve and rotameter, or equivalent, to maintain a constant
sampling rate within 10 percent. (Note: The tester may elect to install a
back-pressure regulator to maintain the sample gas manifold at a constant
pressure in order to protect the analyzer(s) from over-pressurization, and to
minimize the need for flow rate adjustments.)
5.1.9 Sample Gas Manifold.
A sample gas
manifold, to divert a portion of the sample gas stream to the analyzer and the
remainder to the by-pass discharge vent. The sample gas manifold should also
include provisions for introducing calibration gases directly to the analyzer.
The manifold may be constructed of any material that is non-reactive to the gas
being sampled.
5.1.10 Gas Analyzer.
A UV or NDIR
absorption or fluorescence analyzer, to determine continuously the SO2 concentration in the sample gas stream.
The analyzer shall meet the applicable performance specifications of Section 4. A means of controlling the analyzer flow rate
and a device for determining proper sample flow rate (e.g., precision
rotameter, pressure gauge downstream of all flow controls, etc.) shall be
provided at the analyzer. (Note: Housing the analyzer(s) in a clean,
thermally-stable, vibration-free environment will minimize drift in the
analyzer calibration.)
5.1.11 Data Recorder.
A strip chart
recorder, analog computer, or digital recorder, for recording measurement data.
The data recorder resolution (i.e., readability) shall be 0.5 percent of span.
Alternatively, a digital or analog meter having a resolution of 0.5 percent of
span may be used to obtain the analyzer responses and the readings may be
recorded manually. If this alternative is used, the readings shall be obtained
at equally spaced intervals over the duration of the sampling run. For sampling
run durations of less than 1 hour, measurements at 1-minute intervals or a
minimum of 30 measurements, whichever is less restrictive, shall be obtained.
For sampling run durations greater than 1 hour, measurements at 2-minute
intervals or a minimum of 96 measurements, whichever is less restrictive, shall
be obtained.
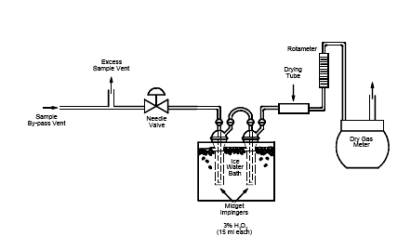
5.2 Method 6 Apparatus and Reagents.
The apparatus
and reagents described in Method 6 and shown by the schematic of the sampling
train in Figure 6C-2 are used to conduct the
interference check.
5.3 SO2 Calibration Gases.
The
calibration gases for the gas analyzer shall be SO2 in N2
or SO2 in air. Alternatively, SO2/CO2,
SO2/O2,
or SO2/CO2/O2 gas mixtures in N2 may be used. For fluorescence-based
analyzers, the O2 and CO2 concentrations
of the calibration gases as introduced to the analyzer shall be within 1
percent (absolute) O2
and 1 percent (absolute) CO2 of the O2 and
CO2 concentrations
of the effluent samples introduced to the analyzer. Alternatively, for fluorescence-based
analyzers, use calibration blends of SO2 in
air and the nomographs provided by the vendor to determine the quenching
correction factor (the effluent O2 and
CO2 concentrations must be known). Use three
calibration gases as specified below:
5.3.1 High-Range Gas.
Concentration
equivalent to 80 to 100 percent of the span.
5.3.2 Mid-Range Gas.
Concentration
equivalent to 40 to 60 percent of the span.
5.3.3 Zero Gas.
Concentration
of less than 0.25 percent of the span. Purified ambient air may be used for the
zero gas by passing air through a charcoal filter or through one or more
impingers containing a solution of 3 percent H2O2 .
6. MEASUREMENT SYSTEM PERFORMANCE TEST PROCEDURES
Perform the
following procedures before measurement of emissions (Section
7).
6.1 Calibration Gas Concentration Verification.
There are two
alternatives for establishing the concentrations of calibration gases.
Alternative No. 1 is preferred.
6.1.1 Alternative No. 1—
Use of
calibration gases that are analyzed following the Environmental Protection
Agency Traceability Protocol No. 1 (see Citation 1 in
Bibliography). Obtain a certification from the gas manufacturer that Protocol
No. 1 was followed.
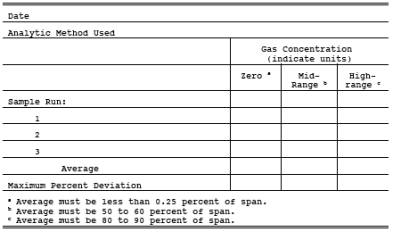
6.1.2 Alternative No. 2—
Use of
calibration gases not prepared according to Protocol No. 1. If this alternative
is chosen, obtain gas mixtures with a manufacturer's tolerance not to exceed ±2
percent of the tag value. Within 6 months before the emission test, analyze
each of the calibration gases in triplicate using Method 6. Citation
2 in the Bibliography describes procedures and techniques that may be used
for this analysis. Record the results on a data sheet (example is shown in Figure 6C-3). Each of the individual SO2 analytical results for each calibration
gas shall be within 5 percent (or 5 ppm, whichever is greater) of the
triplicate set average; otherwise, discard the entire set and repeat the
triplicate analyses. If the average of the triplicate analyses is within 5
percent of the calibration gas manufacturer's cylinder tag value, use the tag
value; otherwise, conduct at least three additional analyses until the results
of six consecutive runs agree within 5 percent (or 5 ppm, whichever is greater)
of the average. Then use this average for the cylinder value.
6.2 Measurement System Preparation.
Assemble the
measurement system by following the manufacturer's written instructions for
preparing and preconditioning the gas analyzer and, as applicable, the other
system components. Introduce the
calibration gases in any sequence, and make all necessary adjustments to
calibrate the analyzer and the data recorder. Adjust system components to
achieve correct sampling rates.
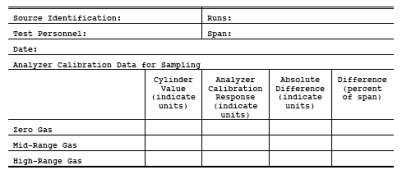
6.3 Analyzer Calibration Error.
Conduct the
analyzer calibration error check by introducing calibration gases to the
measurement system at any point upstream of the gas analyzer as follows:
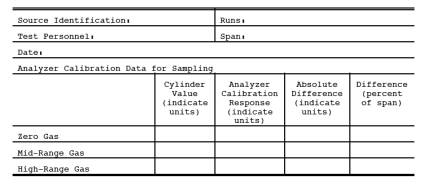
6.3.1 After the measurement system has been
prepared for use, introduce the zero, mid-range, and high-range gases to the
analyzer. During this check, make no adjustments to the system except those
necessary to achieve the correct calibration gas flow rate at the analyzer.
Record the analyzer responses to each calibration gas on a form similar to Figure 6C-4. Note: A calibration curve established prior to
the analyzer calibration error check may be used to convert the analyzer
response to the equivalent gas concentration introduced to the analyzer.
However, the same correction procedure shall be used for all effluent and
calibration measurements obtained during the test.
6.3.2 The analyzer calibration error check
shall be considered invalid if the gas concentration displayed by the analyzer
exceeds ±2 percent of the span for any of the calibration gases. If an invalid
calibration is exhibited, take corrective action and repeat the analyzer
calibration error check until acceptable performance is achieved.
6.4 Sampling System Bias Check.
Perform the
sampling system bias check by introducing calibration gases at the calibration
valve installed at the outlet of the sampling probe. A zero gas and either the
mid-range or high-range gas, whichever most closely approximates the effluent
concentrations, shall be used for this check as follows:
6.4.1 Introduce the upscale calibration gas,
and record the gas concentration displayed by the analyzer on a form similar to
Figure 6C-5. Then introduce zero gas, and record the gas
concentration displayed by the analyzer. During the sampling system bias check,
operate the system at the normal sampling rate, and make no adjustments to the
measurement system other than those necessary to achieve proper calibration gas
flow rates at the analyzer. Alternately introduce the zero and upscale gases
until a stable response is achieved. The tester shall determine the measurement
system response time by observing the times required to achieve a stable
response for both the zero and upscale gases. Note the longer of the two times
as the response time.
6.4.2 The sampling system bias check shall be considered
invalid if the difference between the gas concentrations displayed by the
measurement system for the analyzer calibration error check and for the
sampling system bias check exceeds ±5 percent of the span for either the zero
or upscale calibration gases. If
an invalid calibration is exhibited, take corrective action, and repeat the
sampling system bias check until acceptable performance is achieved. If
adjustment to the analyzer is required, first repeat the analyzer calibration
error check, then repeat the sampling system bias check.
7. EMISSION TEST PROCEDURE
7.1 Selection of Sampling Site and Sampling Points.
Select a
measurement site and sampling points using the same criteria that are
applicable to Method 6.
7.2 Interference Check Preparation.
For each
individual analyzer, conduct an interference check for at least three runs per
during the initial field test on a particular source category. Retain the
results, and report them with each test performed on that source category. If
an interference check is being performed, assemble the modified Method 6 train
(flow control valve, two midget impingers containing 3 percent H2O2,
and dry gas meter) as shown in Figure 6C-2. Install the sampling train to
obtain a sample at the measurement system sample by-pass discharge vent. Record
the initial dry gas meter reading.
7.3 Sample Collection.
Position the
sampling probe at the first measurement point, and begin sampling at the same
rate as used during the sampling system bias check. Maintain constant rate
sampling (i.e., ±10 percent) during the entire run. The sampling time per run
shall be the same as for Method 6 plus twice the average system response time.
For each run, use only those measurements obtained after twice the response
time of the measurement system has elapsed to determine the average effluent
concentration. If an interference check is being performed, open the flow
control valve on the modified Method 6 train concurrent with the initiation of
the sampling period, and adjust the flow to 1 liter per minute (±10 percent).
(Note: If a pump is not used in the modified Method 6 train, caution should be
exercised in adjusting the flow rate since over-pressurization of the impingers
may cause leakage in the impinger train, resulting in positively biased
results).
7.4 Zero and Calibration Drift Tests.
Immediately
preceding and following each run, or if adjustments are necessary for the
measurement system during the run, repeat the sampling system bias check procedure
described in Section 6.4. (Make no adjustments to the measurement system until
after the drift checks are completed.) Record the analyzer's responses on a
form similar to Figure 6C-5.
7.4.1 If either the zero or upscale calibration
value exceeds the sampling system bias specification, then the run is
considered invalid. Repeat both the analyzer calibration error check procedure
(Section 6.3) and the sampling system bias check procedure (Section 6.4) before
repeating the run.
7.4.2 If both the zero and upscale calibration
values are within the sampling system bias specification, then use the average
of the initial and final bias check values to calculate the gas concentration
for the run. If the zero or upscale calibration drift value exceeds the drift
limits, based on the difference between the sampling system bias check
responses immediately before and after the run, repeat both the analyzer
calibration error check procedure (Section 6.3) and the sampling system bias
check procedure (Section 6.4) before conducting additional runs.
7.5 Interference Check (if performed).
After
completing the run, record the final dry gas meter reading, meter temperature,
and barometric pressure. Recover and analyze the contents of the midget
impingers, and determine the SO2 gas
concentration using the procedures of Method 6. (It is not necessary to analyze
EPA performance audit samples for Method 6.) Determine the average gas
concentration exhibited by the analyzer for the run. If the gas concentrations
provided by the analyzer and the modified Method 6 differ by more than 7
percent of the modified Method 6 result, the run is invalidated.
8. EMISSION CALCULATION
The average
gas effluent concentration is determined from the average gas concentration
displayed by the gas analyzer and is adjusted for the zero and upscale sampling
system bias checks, as determined in accordance with Section 7.4. The average
gas concentration displayed by the analyzer may be determined by integration of
the area under the curve for chart recorders, or by averaging all of the
effluent measurements. Alternatively, the average may be calculated from
measurements recorded at equally spaced intervals over the entire duration of
the run. For sampling run durations of less than 1 hour, measurements at
1-minute intervals or a minimum of 30 measurements, whichever is less
restrictive, shall be used. For sampling run durations greater than 1 hour,
measurements at 2-minute intervals or a minimum of 96 measurements, whichever
is less restrictive, shall be used. Calculate the effluent gas concentration
using Equation 6C-1.
![]()
Where:
C gas = Effluent gas concentration, dry basis,
ppm.
C avg = Average gas concentration indicated by
gas analyzer, dry basis, ppm.
C o = Average of initial and final system
calibration bias check responses for the zero gas, ppm.
C m = Average of initial and final system
calibration bias check responses for the upscale calibration gas, ppm.
C ma = Actual concentration of the upscale
calibration gas, ppm.
1. Traceability Protocol for Establishing
True Concentrations of Gases Used for Calibrations and Audits of Continuous
Source Emission Monitors: Protocol Number 1. U. S. Environmental Protection
Agency, Quality Assurance Division. Research Triangle Park, N.C. June 1978.
2. Westlin, Peter R. and John W. Brown.
Methods for Collecting and Analyzing Gas Cylinder Samples. Source Evaluation
Society Newsletter. 3(3):5-15. September 1978.
Figure
6C-1. Measurement System Schematic.
Figure
6C-2. Interference Check Sampling Train.
Figure
6C-3. Analysis of Calibration Gases.
Figure
6C-4. Analyzer Calibration Data.
Figure
6C-5. System Calibration Bias and Drift Data.