 |
||
 |
||
|
|
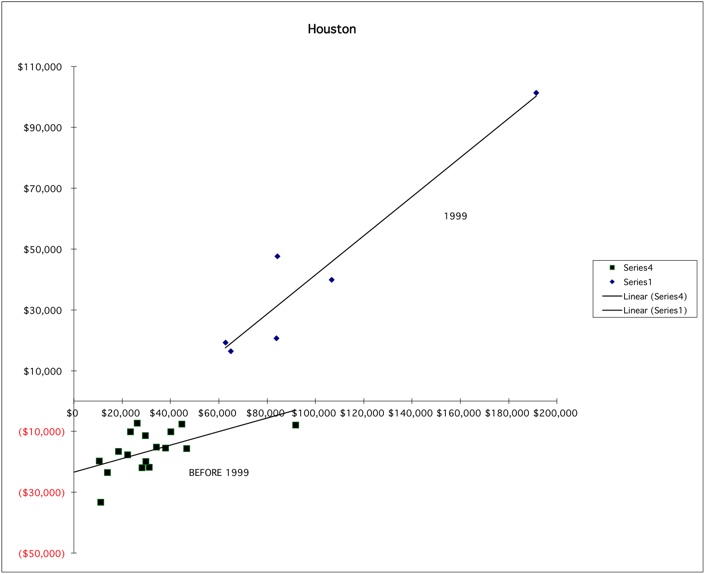
Houston S | Houston P | If Cut Cost | New P | 35% Profit | ||||||||||||||||||||||||||||||||||||||||||
| Jan-97 | $10,531 | ($19,735) | |||||||||||||||||||||||||||||||||||||||||||||
| Feb | ($80) | ($26,129) | |||||||||||||||||||||||||||||||||||||||||||||
| Mar | $26,303 | ($7,207) | |||||||||||||||||||||||||||||||||||||||||||||
| Apr | $22,269 | ($17,644) | |||||||||||||||||||||||||||||||||||||||||||||
| May | $34,096 | ($15,160) | |||||||||||||||||||||||||||||||||||||||||||||
| Jun | $18,581 | ($16,495) | |||||||||||||||||||||||||||||||||||||||||||||
| Jul | $28,172 | ($21,958) | |||||||||||||||||||||||||||||||||||||||||||||
| Aug | $40,202 | ($10,091) | |||||||||||||||||||||||||||||||||||||||||||||
| Sep | $11,200 | ($33,269) | |||||||||||||||||||||||||||||||||||||||||||||
| Oct | $13,913 | ($23,583) | |||||||||||||||||||||||||||||||||||||||||||||
| Nov | $23,500 | ($10,045) | |||||||||||||||||||||||||||||||||||||||||||||
| Dec | $44,654 | ($7,540) | |||||||||||||||||||||||||||||||||||||||||||||
| Jan-98 | $37,891 | ($15,422) | 8000 | ($7,422) | $13,262 | ||||||||||||||||||||||||||||||||||||||||||
| Feb | $31,119 | ($21,717) | 8000 | ($13,717) | $10,892 | ||||||||||||||||||||||||||||||||||||||||||
| Mar | $46,745 | ($15,660) | 8000 | ($7,660) | $16,361 | ||||||||||||||||||||||||||||||||||||||||||
| Apr | $91,751 | ($7,844) | 8000 | $156 | $32,113 | ||||||||||||||||||||||||||||||||||||||||||
| May | $29,645 | ($11,295) | 8000 | ($3,295) | $10,376 | ||||||||||||||||||||||||||||||||||||||||||
| Jun | $29,798 | ($19,813) | 8000 | ($11,813) | $10,429 | ||||||||||||||||||||||||||||||||||||||||||
| Jul | |||||||||||||||||||||||||||||||||||||||||||||||
| Aug | |||||||||||||||||||||||||||||||||||||||||||||||
| Sep | |||||||||||||||||||||||||||||||||||||||||||||||
| Oct | |||||||||||||||||||||||||||||||||||||||||||||||
| Nov | |||||||||||||||||||||||||||||||||||||||||||||||
| Dec | |||||||||||||||||||||||||||||||||||||||||||||||
| Jan-99 | 84234 | 47673 | |||||||||||||||||||||||||||||||||||||||||||||
| Feb | 65026 | 16410 | |||||||||||||||||||||||||||||||||||||||||||||
| Mar | 83879 | 20623 | |||||||||||||||||||||||||||||||||||||||||||||
| Apr | 62723 | 19196 | |||||||||||||||||||||||||||||||||||||||||||||
| May | 191428 | 101417 | |||||||||||||||||||||||||||||||||||||||||||||
| Jun | 106641 | 39818 | |||||||||||||||||||||||||||||||||||||||||||||
| Jul | |||||||||||||||||||||||||||||||||||||||||||||||
| Aug | |||||||||||||||||||||||||||||||||||||||||||||||
| Sep | |||||||||||||||||||||||||||||||||||||||||||||||
| Oct | |||||||||||||||||||||||||||||||||||||||||||||||
| Nov | |||||||||||||||||||||||||||||||||||||||||||||||
| Dec | |||||||||||||||||||||||||||||||||||||||||||||||
|
|||||||||||||||||||||||||||||||||||||||||||||||
| 10% | 20% | 30% | 40% | 50% | |||||||||||||||||||||||||||||||||||||||||||
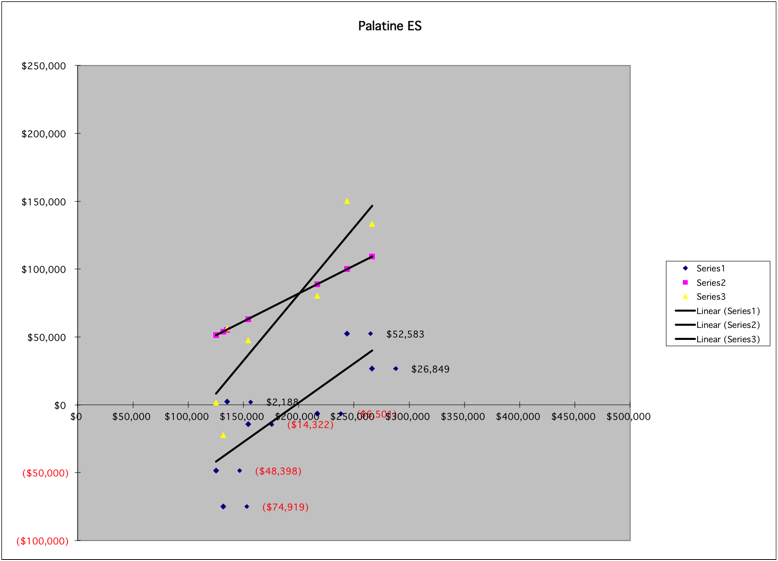
| Month | Palatine ES Sales | Team Profit | Cost Cut | Profit After Cost Cut | 10% Profit After Tax | Break even @ 21% | Price Increase | Price Increase | Price Increase | Price Increase | Price Increase | ||||||||||||||||||||||||||||||||||||
| Jan-97 | $467,715 | $223,293 | |||||||||||||||||||||||||||||||||||||||||||||
| Feb | $467,113 | $149,390 | |||||||||||||||||||||||||||||||||||||||||||||
| Mar | $205,630 | ($63,033) | |||||||||||||||||||||||||||||||||||||||||||||
| Apr | $150,070 | ($60,085) | |||||||||||||||||||||||||||||||||||||||||||||
| May | $336,396 | $115,167 | |||||||||||||||||||||||||||||||||||||||||||||
| Jun | $224,476 | $37,012 | |||||||||||||||||||||||||||||||||||||||||||||
| Jul | $209,379 | $13,019 | |||||||||||||||||||||||||||||||||||||||||||||
| Aug | $188,537 | ($22,252) | |||||||||||||||||||||||||||||||||||||||||||||
| Sep | $388,665 | $180,492 | |||||||||||||||||||||||||||||||||||||||||||||
| Oct | $367,256 | $98,033 | |||||||||||||||||||||||||||||||||||||||||||||
| Nov | $280,387 | $30,273 | |||||||||||||||||||||||||||||||||||||||||||||
| Dec | $278,571 | ($10,915) | |||||||||||||||||||||||||||||||||||||||||||||
| Jan-98 | $216,952 | ($6,501) | 8000 | $1,499 | $88,950 | $45,560 | $15,194 | $36,889 | $58,585 | $80,280 | $101,975 | ||||||||||||||||||||||||||||||||||||
| Feb-98 | $125,183 | ($48,398) | 8000 | ($40,398) | $51,325 | $26,288 | ($35,880) | ($23,361) | ($10,843) | $1,675 | $14,194 | ||||||||||||||||||||||||||||||||||||
| Mar-98 | $266,531 | $26,849 | 8000 | $34,849 | $109,278 | $55,972 | $53,502 | $80,155 | $106,808 | $133,461 | $160,115 | ||||||||||||||||||||||||||||||||||||
| Apr-98 | $131,826 | ($74,919) | 8000 | ($66,919) | $54,049 | $27,683 | ($61,736) | ($48,554) | ($35,371) | ($22,189) | ($9,006) | ||||||||||||||||||||||||||||||||||||
| May-98 | $135,269 | $2,188 | 8000 | $10,188 | $55,460 | $28,406 | $15,715 | $29,242 | $42,769 | $56,296 | $69,823 | ||||||||||||||||||||||||||||||||||||
| Jun-98 | $243,820 | $52,583 | 8000 | $60,583 | $99,966 | $51,202 | $76,965 | $101,347 | $125,729 | $150,111 | $174,493 | ||||||||||||||||||||||||||||||||||||
| Jul-98 | $154,223 | ($14,322) | 8000 | ($6,322) | $63,231 | $32,387 | $1,100 | $16,523 | $31,945 | $47,367 | $62,790 | ||||||||||||||||||||||||||||||||||||
| Aug-98 | |||||||||||||||||||||||||||||||||||||||||||||||
| Sep-98 | |||||||||||||||||||||||||||||||||||||||||||||||
| Oct-98 | |||||||||||||||||||||||||||||||||||||||||||||||
| Nov-98 | |||||||||||||||||||||||||||||||||||||||||||||||
| Dec-98 | |||||||||||||||||||||||||||||||||||||||||||||||
| Jan-99 | |||||||||||||||||||||||||||||||||||||||||||||||
| Feb-99 | |||||||||||||||||||||||||||||||||||||||||||||||
| Mar-99 | |||||||||||||||||||||||||||||||||||||||||||||||
| Apr-99 | |||||||||||||||||||||||||||||||||||||||||||||||
| May-99 | |||||||||||||||||||||||||||||||||||||||||||||||
| Jul-99 | |||||||||||||||||||||||||||||||||||||||||||||||
| Jun-99 | 181678 | ||||||||||||||||||||||||||||||||||||||||||||||
| Average | $181,972 | ($8,931) | 8000 | ($931) | $74,609 | -6% | $9,266 | $27,463 | $45,660 | $63,857 | $82,055 | ||||||||||||||||||||||||||||||||||||
| % Profit | 5% | 15% | 25% | 35% | 45% | ||||||||||||||||||||||||||||||||||||||||||
| $0 | |||||||||||||||||||||||||||||||||||||||||||||||
| 10% | 20% | 30% | 40% | 50% | |||||||||||||||||||||||||||||||||||||||||||
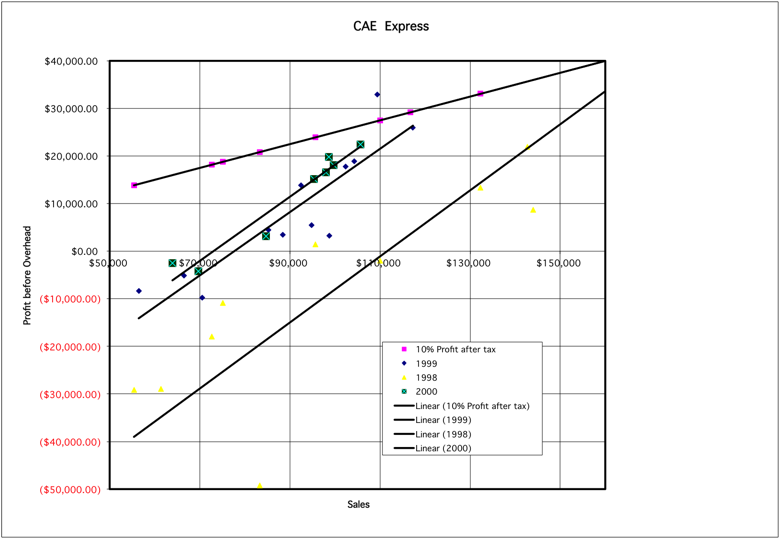
| Month | CAE Express Sales | CAE Express Qtr Sales | Team Profit | Rolling 12m S | Rolling 12m P | CAE Express Qtr Profit | 12m Sales Inc | 10% Profit After 15%Ovh | Break even @ 21% | Price Increase | Price Increase | Price Increase | Price Increase | Price Increase | |||||||||||||||||||||||||||||||||
| Jan-98 | $55,397 | ($29,134) | $13,849.25 | $11,633 | ($23,594) | ($18,055) | ($12,515) | ($6,975) | ($1,436) | ||||||||||||||||||||||||||||||||||||||
| Feb-98 | 132312 | $13,323 | $33,078.00 | $27,786 | $26,554 | $39,785 | $53,017 | $66,248 | $79,479 | ||||||||||||||||||||||||||||||||||||||
| Mar-98 | 116703 | 304412 | ($23,070) | -38881 | $29,175.75 | $24,508 | ($11,400) | $271 | $11,941 | $23,611 | $35,282 | ||||||||||||||||||||||||||||||||||||
| Apr-98 | 95693 | $1,388 | $23,923.25 | $20,096 | $10,957 | $20,527 | $30,096 | $39,665 | $49,235 | ||||||||||||||||||||||||||||||||||||||
| May-98 | 83345 | ($49,230) | $20,836.25 | $17,502 | ($40,896) | ($32,561) | ($24,227) | ($15,892) | ($7,558) | ||||||||||||||||||||||||||||||||||||||
| Jun-98 | 72726 | 251764 | ($17,968) | -65810 | $18,181.50 | $15,272 | ($10,695) | ($3,423) | $3,850 | $11,122 | $18,395 | ||||||||||||||||||||||||||||||||||||
| Jul-98 | 195267 | $78,181 | $48,816.75 | $41,006 | $97,708 | $117,234 | $136,761 | $156,288 | $175,815 | ||||||||||||||||||||||||||||||||||||||
| Aug-98 | 109989 | ($1,999) | $27,497.25 | $23,098 | $9,000 | $19,999 | $30,998 | $41,997 | $52,996 | ||||||||||||||||||||||||||||||||||||||
| Sep-98 | 75159 | 380415 | ($10,904) | 65278 | $18,789.75 | $15,783 | ($3,388) | $4,128 | $11,644 | $19,160 | $26,676 | ||||||||||||||||||||||||||||||||||||
| Oct-98 | 142669 | $21,881 | |||||||||||||||||||||||||||||||||||||||||||||
| Nov-98 | 61341 | ($28,992) |
|
||||||||||||||||||||||||||||||||||||||||||||
| Dec-98 | $143,965 | $347,975 | $8,706 | $1,284,566 | ($37,818) | 1595 | |||||||||||||||||||||||||||||||||||||||||
| Jan-99 | $94,787 | $5,502 | $1,323,956 | ($3,182) | |||||||||||||||||||||||||||||||||||||||||||
| Feb-99 | $98,803 | $3,225 | $1,290,447 | ($13,280) | |||||||||||||||||||||||||||||||||||||||||||
| Mar-99 | $88,380 | $281,970 | $3,468 | $1,262,124 | $13,258 | 12195 | |||||||||||||||||||||||||||||||||||||||||
| Apr-99 | $104,262 | $18,882 | $1,270,693 | $30,752 | |||||||||||||||||||||||||||||||||||||||||||
| May-99 | $70,538 | ($9,799) | $1,257,886 | $70,183 | |||||||||||||||||||||||||||||||||||||||||||
| Jun-99 | $85,240 | $260,040 | $4,504 | $1,270,400 | $92,655 | 13587 | |||||||||||||||||||||||||||||||||||||||||
| Jul-99 | $56,451 | ($8,406) | $1,131,584 | $6,068 | |||||||||||||||||||||||||||||||||||||||||||
| Aug-99 | $117,318 | $26,003 | $1,138,913 | $34,070 | |||||||||||||||||||||||||||||||||||||||||||
| Sep-99 | $109,351 | $283,120 | $32,894 | $1,173,105 | $77,868 | 50491 | |||||||||||||||||||||||||||||||||||||||||
| Oct-99 | $66,507 | ($5,117) | $1,096,943 | $50,870 | |||||||||||||||||||||||||||||||||||||||||||
| Nov-99 | $102,341 | $17,780 | $1,137,943 | $97,642 | Trailing 12 months | $26,016 | -6% | $6,027 | $16,434 | $26,840 | $37,247 | $47,654 | |||||||||||||||||||||||||||||||||||
| Dec-99 | $92,455 | $261,303 | $13,836 | $1,086,433 | $102,772 | 26499 | Sales Growth | Profit Growth | |||||||||||||||||||||||||||||||||||||||
| Jan-00 | $63,936 | ($2,487) | $1,055,582 | $94,783 | -20% | -3079% | 3% | 9% | 15% | 20% | 26% | ||||||||||||||||||||||||||||||||||||
| Feb-00 | $84,687 | $3,169 | $1,041,466 | $94,727 | -19% | -813% | |||||||||||||||||||||||||||||||||||||||||
| Mar-00 | $69,718 | $218,341 | ($4,227) | $1,022,804 | $87,032 | -3545 | -19% | 556% | |||||||||||||||||||||||||||||||||||||||
| Apr-00 | $105,680 | $22,461 | $1,024,222 | $90,611 | -19% | 195% | |||||||||||||||||||||||||||||||||||||||||
| May-00 | $98,629 | $19,842 | $1,052,313 | $120,252 | -16% | 71% | |||||||||||||||||||||||||||||||||||||||||
| Jun-00 | $99,749 | $304,058 | $18,135 | $1,066,822 | $133,883 | 60438 | -16% | 44% | |||||||||||||||||||||||||||||||||||||||
| Jul-00 | $95,373 | $15,122 | $1,105,744 | $157,411 | -2% | 2494% | |||||||||||||||||||||||||||||||||||||||||
| Aug-00 | $98,021 | $16,624 | $1,086,447 | $148,032 | -5% | 334% | |||||||||||||||||||||||||||||||||||||||||
| Sep-00 | $104,848 | $298,242 | $32,351 | $1,081,944 | $147,489 | 64097 | -8% | 89% | |||||||||||||||||||||||||||||||||||||||
| Oct-00 | $108,225 | $31,194 | $1,123,662 | $183,800 | 2% | 261% | |||||||||||||||||||||||||||||||||||||||||
| Nov-00 | $110,329 | $24,027 | $1,131,650 | $190,047 | -1% | 95% | |||||||||||||||||||||||||||||||||||||||||
| Dec-00 | $142,899 | $361,453 | $4,394 | $1,182,094 | $180,605 | 59615 | 9% | 76% | |||||||||||||||||||||||||||||||||||||||
| Jan-01 | $110,711 | $18,594 | $1,228,869 | $201,686 | 16% | 113% | |||||||||||||||||||||||||||||||||||||||||
| Feb-01 | $113,241 | $31,089 | $1,257,423 | $229,606 | 21% | 142% | |||||||||||||||||||||||||||||||||||||||||
| Mar-01 | $146,356 | $370,308 | $47,154 | $1,334,061 | $280,987 | 96837 | 30% | 223% | |||||||||||||||||||||||||||||||||||||||
| Month | Denver ES Sales | Team Profit | Sales Correction | Sales Corrected | Profit Corrected | Cost | 10% Profit After Tax | Break even @ 21% | Price Increase | Price Increase | Price Increase | Price Increase | Price Increase | ||||||||||||||||||||||||||||||||||
| Jan-97 | $14,013 | ($28,856) | |||||||||||||||||||||||||||||||||||||||||||||
| Feb | $81,927 | $29,243 | |||||||||||||||||||||||||||||||||||||||||||||
| Mar | $79,095 | $2,218 | |||||||||||||||||||||||||||||||||||||||||||||
| Apr | $100,406 | $28,150 | |||||||||||||||||||||||||||||||||||||||||||||
| May | $81,524 | $4,132 | |||||||||||||||||||||||||||||||||||||||||||||
| Jun | $68,268 | $6,599 | |||||||||||||||||||||||||||||||||||||||||||||
| Jul | $29,573 | ($23,566) | |||||||||||||||||||||||||||||||||||||||||||||
| Aug | $341,541 | $207,087 | |||||||||||||||||||||||||||||||||||||||||||||
| Sep | $97,844 | ($87,320) | |||||||||||||||||||||||||||||||||||||||||||||
| Oct | $67,630 | $903 | |||||||||||||||||||||||||||||||||||||||||||||
| Nov | $70,817 | ($21,121) | |||||||||||||||||||||||||||||||||||||||||||||
| Dec | $13,480 | ($28,765) | |||||||||||||||||||||||||||||||||||||||||||||
| Jan-98 | $39,409 | ($36,347) | $39,409 | ($36,347) | $75,756 | $16,158 | $8,276 | ($32,406) | ($28,465) | ($24,524) | ($20,583) | ($16,643) | |||||||||||||||||||||||||||||||||||
| Feb-98 | $141,669 | $86,237 | -60000 | $81,669 | $26,237 | $55,432 | $58,084 | $29,750 | $100,404 | $114,571 | $128,738 | $142,905 | $157,072 | ||||||||||||||||||||||||||||||||||
| Mar-98 | $31,870 | ($8,256) | $31,870 | ($8,256) | $40,126 | $13,067 | $6,693 | ($5,069) | ($1,882) | $1,305 | $4,492 | $7,679 | |||||||||||||||||||||||||||||||||||
| Apr-98 | $68,009 | $22,355 | ($36,000) | $32,009 | ($13,645) | $45,654 | $27,884 | $14,282 | $29,156 | $35,957 | $42,758 | $49,559 | $56,360 | ||||||||||||||||||||||||||||||||||
| May-98 | $139,918 | $60,571 | $139,918 | $60,571 | $79,347 | $57,366 | $29,383 | $74,563 | $88,555 | $102,546 | $116,538 | $130,530 | |||||||||||||||||||||||||||||||||||
| Jun-98 | $41,509 | ($50,648) | $41,509 | ($50,648) | $92,157 | $17,019 | $8,717 | ($46,497) | ($42,346) | ($38,195) | ($34,044) | ($29,894) | |||||||||||||||||||||||||||||||||||
| Jul-98 | $57,635 | $4,576 | $57,635 | $4,576 | $53,059 | $23,630 | $12,103 | $10,340 | $16,103 | $21,867 | $27,630 | $33,394 | |||||||||||||||||||||||||||||||||||
| Aug-98 | ($18,232) | ($68,476) | $36,000 | $17,768 | ($32,476) | $50,244 | |||||||||||||||||||||||||||||||||||||||||
| Sep-98 | $2,834 | ($45,740) | $30,000 | $32,834 | ($15,740) | $48,574 | |||||||||||||||||||||||||||||||||||||||||
| Oct-98 | $8,275 | ($30,144) | $10,000 | $18,275 | ($20,144) | $38,419 | |||||||||||||||||||||||||||||||||||||||||
| Nov-98 | $41,097 | $3,587 | $10,000 | $51,097 | $13,587 | $37,510 | |||||||||||||||||||||||||||||||||||||||||
| Dec-98 | $0 | $0 | $0 | ||||||||||||||||||||||||||||||||||||||||||||
| Jan-99 | |||||||||||||||||||||||||||||||||||||||||||||||
| Feb-99 | |||||||||||||||||||||||||||||||||||||||||||||||
| Mar-99 | |||||||||||||||||||||||||||||||||||||||||||||||
| Apr-99 | |||||||||||||||||||||||||||||||||||||||||||||||
| May-99 | |||||||||||||||||||||||||||||||||||||||||||||||
| Jun-99 | |||||||||||||||||||||||||||||||||||||||||||||||
| Average | $50,363 | ($5,662) | -1666.666667 | $45,333 | $30,458 | -6% | $18,641 | $26,070 | $33,499 | $40,928 | $48,357 | ||||||||||||||||||||||||||||||||||||
| % Profit | 10% | 14% | 18% | 22% | 27% | ||||||||||||||||||||||||||||||||||||||||||
|
|
|||||||||||||||||||||||||||||||||||||||||||||||
| Constants | $48,000 | 46% | 93% | ||||||||||||||||||||||||||||||||||||||||||||
| Month | France ∆ WIP Sales | France Equip Sales | France Rental + Field Sales | Total Sales | USA Profit Aft Var | Exchange Var | France Profit Bef Var | YTD Sales | Profit Formula | ∆ | ∆ Squared | Cost | 10% Profit After Tax | Break even @ 21% | |||||||||||||||||||||||||||||||||
| Jan-98 | $2,014 | $34,584 | $36,598 | ($29,732)[1] | ($14,910) | ($14,822) | 219,678,641 | ||||||||||||||||||||||||||||||||||||||||
| Feb-98 | $68,521 | $24,149 | $92,670 | $35,824 [2] | $5,978 | $29,846 | 890,769,987 | ||||||||||||||||||||||||||||||||||||||||
| Mar-98 | $2,184 | $29,633 | $31,817 | ($46,775)[3] | $161,085 | ($19,437) | ($27,338) | 747,384,287 | |||||||||||||||||||||||||||||||||||||||
| Apr-98 | $18,208 | $24,576 | $42,784 | ($61,845) | ($16,769) | ($45,076) | 2,031,878,231 | ||||||||||||||||||||||||||||||||||||||||
| May-98 | $38,419 | $27,838 | $66,257 | $489 [4] | ($4,438) | $4,927 | 24,274,541 | ||||||||||||||||||||||||||||||||||||||||
| Jun-98 | $9,555 | $45,751 | $55,306 | ($11,821)[5] | $325,432 | ($1,056) | ($10,765) | 115,879,412 | |||||||||||||||||||||||||||||||||||||||
| Jul-98 | $78,921 | $46,076 | $124,997 | $14,127 | $31,154 | ($17,027) | 289,930,307 | ||||||||||||||||||||||||||||||||||||||||
| Aug-98 | $32,534 | $18,091 | $50,625 | ($46,296) | ($16,210) | ($30,086) | 905,183,643 | ||||||||||||||||||||||||||||||||||||||||
| Sep-98 | $2,754 | $88,823 | $91,577 | $55,058 | $35,872 | $19,186 | 368,093,770 | ||||||||||||||||||||||||||||||||||||||||
| Oct-98 | $8,004 | $45,290 | $53,294 | ($16,982)[6] | ($2,198) | ($14,784) | 218,553,055 | ||||||||||||||||||||||||||||||||||||||||
| Nov-98 | $11,190 | $65,495 | $76,685 | $29,789 | $18,058 | $11,731 | 137,622,227 | ||||||||||||||||||||||||||||||||||||||||
| Dec-98 | $3,032 | $43,184 | $46,216 | ($47,873) | |||||||||||||||||||||||||||||||||||||||||||
| Jan-99 | $17,171 | $36,079 | $53,250 | ($667) | ($6,548) | $5,881 | 34,584,632 | $7,040 | $3,606 | ||||||||||||||||||||||||||||||||||||||
| Feb-99 | $16,649 | $18,149 | $34,798 | ($31,555) | ($23,463) | ($8,092) | 65,482,244 | $6,826 | $3,496 | ||||||||||||||||||||||||||||||||||||||
| Mar-99 | $8,026 | $48,468 | $56,494 | $5,614 | $144,542 | $767 | $4,847 | 23,491,470 | $3,291 | $1,685 | |||||||||||||||||||||||||||||||||||||
| Apr-99 | $18,573 | $33,501 | $33,303 | $66,804 | ($5,828) | ($1,618) | ($4,210) | 17,726,205 | $13,735 | $7,035 | |||||||||||||||||||||||||||||||||||||
| May-99 | ($1,039) | $18,532 | $40,477 | $59,008 | ($2,117) | ($1,832) | ($285) | 81,017 | $7,598 | $3,892 | |||||||||||||||||||||||||||||||||||||
| Jun-99 | $28,643 | $33,846 | $62,489 | ($6,848) | $332,843 | ($3,347) | ($3,501) | 12,253,920 | $11,744 | $6,015 | |||||||||||||||||||||||||||||||||||||
| Jul-99 | $649 | $15,897 | $32,182 | $48,079 | $4,544 | ($10,758) | $15,302 | 234,154,876 | $6,518 | $3,338 | |||||||||||||||||||||||||||||||||||||
| Aug-99 | ($286) | $22,784 | $23,057 | $45,841 | ($9,219) | ($16,076) | $6,857 | 47,023,249 | $9,341 | $4,785 | |||||||||||||||||||||||||||||||||||||
| Sep-99 | ($17,677) | $8,237 | $33,562 | $41,799 | ($44,186) | ($12,998) | ($31,188) | 972,671,384 | $3,377 | $1,730 | |||||||||||||||||||||||||||||||||||||
| Oct-99 | $0 | $36,516 | $36,516 | ($31,914) | ($14,040) | ($17,874) | 319,475,586 | $0 | $0 | ||||||||||||||||||||||||||||||||||||||
| Nov-99 | $19,874 | $23,451 | $43,593 | $67,044 | ($12,325) | $3,329 | ($15,654) | 245,046,151 | $9,615 | $4,925 | |||||||||||||||||||||||||||||||||||||
| Dec-99 | ($19,874) | $71,085 | $32,510 | $103,595 | $26,471 | $14,933 | $11,538 | 133,116,214 | $29,145 | $14,928 | |||||||||||||||||||||||||||||||||||||
| Jan-00 | $27,298 | $28,044 | $55,342 | ($11,159) | $5,921 | ($5,238) | ($9,362) | $4,124 | 17,007,376 | $11,192 | $5,733 | ||||||||||||||||||||||||||||||||||||
| Feb-00 | $23,048 | $37,825 | $60,873 | ($3,968) | $836 | ($3,132) | ($2,221) | ($911) | 830,522 | $9,450 | $4,840 | ||||||||||||||||||||||||||||||||||||
| Mar-00 | $19,235 | $50,790 | $70,025 | $7,277 | $2,587 | $9,864 | $186,240 | $8,083 | $1,781 | 3,172,673 | $7,886 | $4,039 | S Projection | P Projection | |||||||||||||||||||||||||||||||||
| Apr-00 | $22,714 | $62,866 | $85,580 | $6,783 | $8,042 | $14,825 | $20,914 | ($6,089) | 37,073,729 | $9,313 | $4,770 | ||||||||||||||||||||||||||||||||||||
| May-00 | $54,801 | $35,061 | $89,862 | $39,838 | ($2,696) | $37,142 | $9,815 | $27,327 | 746,754,545 | $22,468 | $11,508 | $82,222 | $15,088 | ||||||||||||||||||||||||||||||||||
| Jun-00 | $1,005 | $57,229 | $58,233 | ($2,324) | ($4,619) | ($6,943) | $419,915 | $5,685 | ($12,628) | 159,458,158 | $412 | $211 | $80,000 | $16,188 | |||||||||||||||||||||||||||||||||
| Jul-00 | $17,414 | 46554 | $63,968 | $13,344 | $6,299 | $19,643 | $428,541 | $3,306 | $16,337 | 266,908,678 | $44,444 | ($3,712) | |||||||||||||||||||||||||||||||||||
| Aug-00 | $510 | 18762 | $19,272 | ($45,930) | $6,776 | ($39,154) | $386,940 | ($30,317) | ($8,837) | 78,097,164 | $64,444 | $3,432 | |||||||||||||||||||||||||||||||||||
| Sep-00 | $133,000 | 60000 | $0 | ||||||||||||||||||||||||||||||||||||||||||||
| Oct-00 | $848,218 | $36,219 | ($36,219) | 1,311,850,318 | |||||||||||||||||||||||||||||||||||||||||||
| Nov-00 | |||||||||||||||||||||||||||||||||||||||||||||||
| Dec-00 | ($2,418) | 17,624 | |||||||||||||||||||||||||||||||||||||||||||||
| 99 YTD xJAn | |||||||||||||||||||||||||||||||||||||||||||||||
| $165,515 | $318,369 | $483,883 | $49,791 | ||||||||||||||||||||||||||||||||||||||||||||
| 1988 x dec | |||||||||||||||||||||||||||||||||||||||||||||||