GE Remote Services
Abstract
As deregulation becomes a reality for the power generation
industry and as competitive power production becomes standard operating
procedure, the quality of power a company produces becomes the measure of its
success. This requires the utility, independent power producer (IPP), and/or
industrial power producer to bid power competitively at current market rates.
The power producer that operates at the lowest cost per kilowatt-hour will
thrive in this challenging environment.
GE Power Systems and its Energy Services business offer an
abundance of products aimed at increasing the availability and reducing the
cost of plant operation. These include long-term service agreements (LTSA);
operation and maintenance (O&M) contracts; inventory-management programs;
life-extension services; refurbished turbine parts offerings; and remote
services (RS), an integrated management tool that helps customers meet their
plant life-cycle objectives. This paper is focused on new developments in RS over
the past four years.
Introduction
Increasing competition has caused power plants to switch
from traditional time-based maintenance strategies to those based on a plant’s
operating condition. In order to stay competitive, power producers such as
utilities, IPPs and industrials have focused their efforts on improving the
availability of plant equipment, reducing maintenance costs and becoming the
lowest- cost producer. To meet this need, GE’s Monitoring and Diagnostic Center
(M&DC) developed RS, which provides real-time data assessments and
recommendations from remote locations to improve the availability and
performance of equipment, systems and plants. The main elements of the RS
process are monitoring and communication, on-site data acquisition and monitoring
system, and communication vehicles such as the satellite, the Internet, the
telephone and the LAN.
GE has designed, manufactured or commissioned more than
50% of the world’s installed base of power generation equipment and maintains
the largest field sales and service workforce in the industry. The M&DC’s
RS strategy combines GE’s considerable practical experience in O&M with the
M&DC’s expertise in remote diagnostics gained through the deployment of
over 150 units with RS features. This allows customers to respond quickly to a
rapidly changing environment by extending the intervals between maintenance
outages, reducing the duration of scheduled outages, maximizing plant
performance, predicting life cycles, optimizing plant output, reducing unplanned
outage events and managing the timing of those which do occur, as well as
providing operating recommendations that maximize the revenue stream and
decrease plant life-cycle costs. The critical components of RS and their
functions are:
- Monitoring
and communication
On-site data acquisition and monitoring system
Communication vehicles such as the satellite, the
Internet, telephone and the LAN
- Data
infrastructure and collection
Measurement and analysis of equipment condition and
performance
Comparison of conditions to fleet and equipment baselines, design specification and experience
Communication of relevant data to the M&DC
- Technical
advice
Identification and isolation of problems
Root-cause analysis and experience-based learning
Problem reporting and corrective action
recommendation
Data archiving and unit/fleet analysis
A broad range of service modules are available to cover
equipment at component, system or plant level.
- Service
program modules
(Telediagnostics) gas turbine generator health report
(GTD) gas turbine diagnostics
(GD) generator diagnostics
(Enter) online heat balance analysis.
GE Energy Services’ RS Solution
GE’s RS solution provides the ability to collect, validate
and analyze operational data from a customer’s equipment. Operational data is
reviewed at different frequencies, depending on the RS modules supplied. The
review can take place on an as-needed or a continuous basis. Concurrent
analysis is performed on site in real time and at the M&DC. This
methodology is designed to identify operating anomalies (symptoms and/or
indications) or incipient problems and, thus, provide validated solutions. If
an anomaly is detected on site, the system automatically notifies diagnostic
specialists at the M&DC. Figure 1 outlines
the design, organizational structure and functionality of the M&DC.
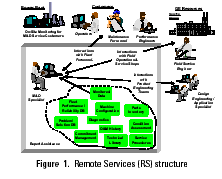
Diagnostic specialists are able to connect to equipment
remotely to examine its operation and performance or investigate the nature of
a problem in addition to providing online site consulting to customers. When
warranted, the diagnostic specialist is able to generate recommendations on
plant operations and/or maintenance actions. The recommendations are designed
to maximize the equipment's performance, reliability and availability and,
potentially, extend its outage interval cycle. This process is designed to
occur as a complement to normal plant operating procedures and will allow the
plant manager and operator to use GE's RS as a resource for better-informed
and, thus, higher-quality maintenance and operating decisions.
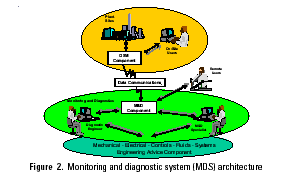
The monitoring and diagnostic system (MDS) architecture
provides networking among a site component (referred to
as the on-site monitor, or OSM), the M&DC, GE expert engineers and a data
communication component (Figure 2).
Plant Monitoring and Diagnostics Concept and Architecture
The concept of a remote monitoring and diagnostic (M&D)
service that provides ready access to operating data, transmits it to a central
location, performs diagnostic evaluation through a combination of automation
and experts, and reports on a plant’s operating condition has existed for some
time. Numerous technical papers have been written about monitoring and
diagnostics, each of which is specific in nature and often deals with a single
issue such as vibration or performance of a single piece of equipment.
Very few publications describe a detailed approach to
monitoring a fleet of similar machines with variable features. This paper
should fill that void by describing various technologies that were developed
over the past decade for monitoring such a fleet. A power plant fleet consists
of gas turbines, steam turbines, generators and balance of plant (BOP). The
infrastructure needed to diagnose an entire range of issues that affect a fleet
of turbines is presented here, and only examples of only GE’s gas turbine fleet
will be cited to reduce the paper's scope.
Figure 3 provides a pictorial summary of the remote fleet-monitoring concept. Two functional components, an MDS and a central M&DC, monitor a fleet of turbines. The MDS consists of an OSM; a computer that logs data from the power plant’s control system; various telecommunication technologies; and a network of computer systems, located at a central M&DC, that archive fleet operating data and perform diagnostics and reporting functions. The OSM measures and analyzes large amounts of data, detects anomalous conditions and then transmits information to the M&DC for further analysis on the condition of equipment; compares conditions to equipment baselines, design specifications and experience; and communicates the relevant information to customer personal.
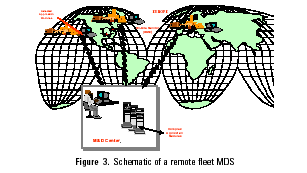
The M&DC can additionally interpret fleet data and
provide advice to the remote operators regarding plant operations as and when
needed. This includes commissioning and startup support, optimizing plant
operations and critical shutdown scenarios that are not handled by the plant
control systems. The M&DC performs these functions by using modules
(querying and archiving the data periodically), trend analysis, problem
identification and isolation, root-cause analysis and experience-based
learning, problem reporting, and recommendations for corrective action.
Although a variety of equipment needs to be monitored, the
principles of M&D are similar and common tools and processes are used where
practical. Special and highly engineered software is also used to detect unique
anomalies and aids the diagnostic team in reporting and recommendations. GE’s
Energy Services M&DC is a single M&DC monitoring different types of
turbomachinery applications. It is located in Atlanta, GA.
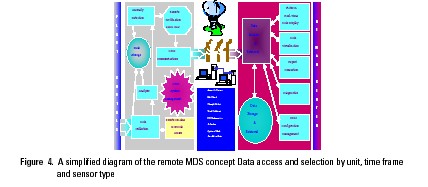
A simple diagram of the remote monitoring and diagnostics
(M&D) concept of regularly transferring operational data to determine the
current operating condition of a plant is depicted in Figure 4. All operational data collected is validated through
advanced mathematical algorithms before it is used. Transient and steadystate
(startup, shutdown, load-change) data are utilized in problem diagnosis. Also,
past and current data and relevant baselines are utilized in discovering
operational anomalies, which are detected on the OSM and at the M&DC.
Anomalies detected on the OSM are usually operational or unusual equipment
problems that have not been detected by the control system and require immediate
attention by the M&DC. Thus, detection of a first-level deviation is
performed on site by the OSM. Detection of anomalies that develop over several
hours or days is performed at the M&DC. Methods and approaches for
detecting anomalies include the following:
- Time
trending of sensor data, individually or in a group
- Cross
correlation and regression analysis of operational data
- Time-series
analysis to identify periodic discrepancies
- Comparison
with fleetwide operational data and design specification
Many of the well-understood root-cause algorithms have been
catalogued and automated using advanced mathematical and computational
techniques to resolve operational problems quickly. Root-cause assessments of
all operational anomalies, deviations in performance and abnormalities in
maintenance condition are used as a basis for determining whether operational
and maintenance recommendations are required.
Trend monitoring is performed at the M&DC to identify
long-term deviations in condition and performance. This provides a means to
highlight and detect emerging problems well in advance of actual failures and
identify subtle deviations in performance that may be indicators of emerging
problems. Thus, although mature anomaly-detection algorithms are deployed on the
OSM, when necessary, more detailed root-cause analyses and diagnostic functions
are performed by experts at the M&DC.
The M&D Viewer
Many specialists and engineers employ the M&D system’s
user interface to display archived operational data for diagnostic assessments
and associated preliminary recommendations. It manages periodic assessment
functions, performs selected assessments on demand, carries out hypothetical
assessments, conducts remote OSM administrative functions and displays real
time operational data (up to a one-secondupdate rate).
A variety of on-site and remote clients use the M&D
viewer to access diagnostic results and operational data. A flexible and open
system with Internet data access capabilities is provided to satisfy this need.
Diagnostics Functionality
The M&D system provides detection, notification and
diagnoses of automated and manual anomalies to assist the diagnostic specialist
in making assessments and determining operational and maintenance
recommendations.
Validated Sensor Data
All operational data collected is validated by thresholding
and cross checking, as appropriate. The validation is complementary to but more
detailed than the range checking carried out on the OSM. Support is provided for both
transient and steady-state operating conditions. Transient conditions include
startup, shutdown and load change. In steady-state operations, trending and
rate-of-change monitoring is provided. Invalid sensor data would be flagged and
highlighted in any analysis or report.
Trend Unit Health and Performance
The trending of equipment and system health and performance
is accomplished by using operational data collected from the OSM as well as
historical operating data. The operational data includes monitored sensors
(pressure and temperature) as well as derived sensors (enthalpy). Manual entry
of operational observations (e.g., visual, NDE, meteorological) will be
recorded as needed.
Assessment of a unit's health and performance calculations
(e.g., its efficiency and thermal performance) is carried out periodically to
track the condition of each monitored unit over time and to build up its health
and performance history. All performance data and results are normalized to ISO
conditions as appropriate to facilitate comparison of unit-specific data over
time. This will also facilitate comparisons between similar units and
comparison of unit data to design specifications.
Detection of Anomalies
The M&D system utilizes a unit’s current and historical
health and performance data and applicable baseline data to detect anomalies
(e.g., higher-than-expected vibration levels or significant deviation in
performance from what is expected). Detection of an anomaly is composed of two
components: real-time assessment within the OSM (minutes to hours) and data
evaluation over an extended time frame (12 hours or more).
- Methods
for and approaches to detecting anomalies include the following:
- Data
access and selection by unit, time frame or sensor type
- Time
trending of individual datum or data groups
- Consultation
with symptom/cause database using indicators computed from the operational
data
- Comparison
with fleetwide data and design specifications
The relevant baselines to be used as benchmarks include the
historical performance of the unit, fleet averages for similar units and the
design-specification performance of the given unit and its subcomponents.
Maintenance and operation logs will be consulted (Figure 4).
Root-Cause Analysis
Root-cause analysis is aided by an automated diagnostic
system that includes cause-and-effect knowledge of equipment-specific failure,
equipment design knowledge, past problem/solution information and the
site-specific configuration. Its key purpose is to provide the necessary
technical input for determining appropriate maintenance or operating
recommendations.
Once a problem is defined, its root cause must be
determined. To do that, a cause-and-effect diagram is constructed that relates
each problem to its underlying cause. It also shows the hierarchical nature of
the process because problems often have causes that can themselves be
considered problems with causes. Take, for example, a low turbine efficiency
that is caused by low compressor efficiency that is caused by aerodynamic
losses due to deposits.
Recommendations for Operators
The M&D specialists and diagnostic engineers develop
short-term operation recommendations (such as Run at reduced power levels or Adjust
operating settings) and long-term
data-collection or maintenance recommendations (such as Plan for a
shutdown within two weeks to further assess the unit’s condition or Perform a gas turbine water wash on-line
or off-line) as appropriate to a unit's
health anomalies. The diagnostics engineer will also consider measures that can
be taken while a unit is operating (e.g., on-line against off-line actions).
The M&D diagnostic engineer will, upon determination of
a problem, provide recommendations for avoiding unplanned outages, minimizing
possible secondary damage, enhancing the reliability and availability of the
units, maintaining the intended level of performance and optimizing unit
performance.
Product
Functionality
Although power plant rotating
machines are carefully designed with high levels of safety and exceptional
performance, operating flaws can still occur. The M&D system has been
designed to predict these deviations and provide recommendations so operators
can prevent serious failures or deviations from peak performance. Typical
evaluations that the M&D system is able to make on the steam turbine, gas
turbine and generator are listed below.
Steam Turbine, Gas Turbine and Generator Assessment:
- Performance
Monitoring turbine and generator
performance parameters (baseline predictions) Detecting performance deviations
Discovering and identifying causes
of performance problems early on
- Vibration
Assessment
Rotor train vibration monitoring
Remote access analysis programs
Engineering-advised vibration
diagnostics
The OSM
The OSM is an assembly of electronic components that incorporate
microprocessor technology. It is designed and fabricated to perform integrated
monitoring, data analysis and communication to a centralized M&D data
server. The OSM is installed on site and receives data from plant systems.
Primary OSM functions are acquisition of operational data
from plant equipment, performance of anomaly detection for deviations from
baseline and buffering the data for subsequent transmission to the M&DC.
The OSM can interface with various devices (e.g., the unit
control system, DCS and thirdparty systems) and collect operational data from
them. In addition, it will perform analysis on the data, provide temporary
storage of operational data and communicate data remotely. The OSM provides a
first level of anomaly detection and notification, which alerts on-site
personnel and the M&DC to developing problems or potential issues. The OSM
allows the diagnostic specialist remote access to the customer’s equipment to
allow real-time viewing of the operating data.
The OSM's functions are performed independently. Data
collection, processing and buffering, deviation detection and notification are
performed as needed for the unit-monitored equipment. Detected events and trips
will not impair the OSM's real-time data-collection performance, nor will
M&DC or engineering-initiated interactions and local-user-initiated
interactions.
A calculation engine aboard the OSM uses high-fidelity data
to produce calculations of the equipment’s operating mode, performance,
vibration and equipment-specific parameters. Within its architecture is an
action engine that can trigger remote notification when anomalies are detected.
A single OSM can monitor multiple pieces of equipment
installed at a plant site. The OSM software is standardized but highly configurable
so that together with the flexible data interfaces, the OSM can be tailored to
the needs of the site-specific installation to be monitored. The OSM also
provides local and remote capability for RS system configuration. In addition
to providing notification of an anomaly, the OSM is an Internet interface that
provides on-line access to selected portions of the operating data archives.
Gas Turbine Diagnostics
Module (GTDM)
The GTDM is a monitoring strategy that focuses on specific
equipment behaviors and monitors them on a nearly continuous basis. Failure
modes are detected and managed through an OSM and M&DC experience
procedures. Specifically, avoiding gas turbine rotor and combustion operation
issues have been key to assuring that customers maximize turbine run times.
M&D specialists and M&D engineering work closely to understand the
plant operating characteristics by monitoring vibration and combustion
parameters. Plant operation is then understood by using these data profiles,
and a monitoring strategy is developed with techniques and software to detect
gas turbine rotor or combustion anomalies.
Gas Turbine Generator
Health Report (GTHR)
The GTHR is a monitoring and diagnosis module that allows
the customer to send stored data to the M&DC for analysis and
interpretation. A modem connection lets GE's diagnostic specialists view the
plant in real time for collaborative troubleshooting. Up to 14 different
systems can be monitored, depending on a unit's complexity and a customer’s
needs, resulting in a description of trends and abnormalities as well as
recommendations for corrective action.
The GTHR module automatically records data from the
three-hour period before a trip, startup or shutdown. Next, this data can be
sent to the M&DC by way of modem for analysis. Data files are transmitted
to the M&DC each month, leading to generation of reports that provide an
overview of the plant's health and recommendations for O&M.
The GTHR determines aspects of plant performance such as
turbine performance and compressor efficiency, which can be used to schedule
water washes. The monthly data analysis allows a GE diagnostic specialist to
detect deviation from normal behavior and to prescribe corrective action.
Generator Diagnostics
Module (GDM)
The GDM is a generator-monitoring module that detects
developing problems and utilizes structured analysis processes and engineering
experience to provide detailed diagnoses and real-time operational
recommendations for corrective action. The recommendations are based on the
monitoring of all relevant data, which is analyzed by the GDM’s expert
knowledge base and checked by generator engineers. Its dynamic tracking
capabilities allow the GDM to detect incipient problems as they develop, often
long before alarm conditions are reached. If followed, these recommendations
will help the customer avoid generator-operating conditions that could cause
damage to the equipment. The diagnosis also will assist maintenance and outage
planning, and the GDM’s information will help the customer to assess a unit's
condition and plan future operation accordingly.
The GDM is a highly capable module. It monitors eight
generator subsystems: core, excitation, hydrogen cooling, lubricating oil, seal
oil, rotor, stator and stator water cooling. Within each of these subsystems
are numerous specific diagnoses; some examples are high core-end temperature,
overfluxing core, reduced hydrogen cooler efficiency, blocked lubricating oil
flow, rotor shorted turns, rotor winding ventilation problems, seal oil vacuum
treatment malfunction, fouled or plugged stator bar coolant path or high stator
cooling-water conductivity.
The GDM provides multimode diagnostics under the following
operating conditions: turning gear, run up, full-speed, no-load and no
excitation, normal-loaded, run down. It performs online sensor data trending
and displays information on multiple Internet screens.
On-line Heat Balance
Analysis Module (HBM)
The HBM uses EfficiencyMap™, GE’s power plant optimization
and performance-monitoring software. It assists the plant's operational staff
in predicting the most profitable way to run the plant and measuring and
tracking changes in plant performance. The HBM tells operators where to set
controllable parameters to maximize profitability. It reduces degradation to
0.5% per year, and it also identifies sensors with poor accuracy and retrieves
and shows results quickly.
The HBM has many useful features. It optimizes plant
operation to maximize profitability while evaluating performance and
determining degradation, validates measurements using model-based plant mass
and energy balances and acquires real-time measurements, and archives data for
easy retrieval and viewing.
Diagnostics Engineering Team
The diagnostics engineering team provides additional
customer contact for technical support on combustion, mechanical, electrical,
performance, vibration, systems and controls expertise. It provides consistent,
high-quality responses to customers' queries and is available seven days a week,
24 hours a day. The technical advice structure allows it to direct O&M
questions rapidly to the proper GE engineer. When the GE engineer receives a
question, a case documenting the situation is opened. The diagnostics
engineering commitment tracking system allows for team utilization of the case
as a problem- solving vehicle. The case is recorded in the technical advice
database as a part of the site history and equipment profile.
There are three tools that help the diagnostics engineering
team provide quick, accurate, experience-based responses: the problem-solution
database, the reference library database and the
reliability/availability/maintenance (RAM) database.
Problem-Solution Database
The problem solution database stores all previous problems
and causes by class for GE and non-GE fleets. Once potential causes are
defined, validation/testing of symptoms of the causes begin. Validation is
conducted by a review of current relevant conditions, similar fleet problems
and solutions, and expert team assessment and advice. A diagnostic engineer is
the overall owner of the specific fleetwide component in question and validates
each problem and solution before it is entered into the database.
Reference Library Database
The reference library database contains the full scope of
technical documents for equipment and system design. It also contains the
design and operating specifications for optimal performance. An example in the
case of a gas tur- bine would be pressure drops across the HRSG and inlet exhaust
systems, including the performance excursions as the unit sees an ambient
temperature change.
Reliability/Availability/Maintenance
This tool gives the diagnostic specialist immediate
reference to monthly RAM data provided by the plant operator. This data
identifies the specific start-and-stop times of plant outages. It also computes
reliability and availability calculations; in addition, it documents plant
outage caused by a specific component. This allows for a model of plant
availability as a function of mode of operation, design, fuel type and other
common parameters. The results of the modeling used in conjunction with M&D
data will be used in making recommendations for configuration and/or operating
changes.
Experience
GE Energy Services has deployed RS
modules on over 150 units around the world and uses M&D as a tool to
manage, analyze and resolve potential equipment problems. Real-time access and
continuous on-line evaluation of turbine condition is available to our
engineers for problem resolution. Several benefits were derived during customer
application.
For example, an IPP partner operating during peak demand was
alerted to a slight deviation from baseline rotor dynamic characteristics.
Shutting down the plant meant up to $1 million in lost revenue per day.
Immediately, GE engineers were online, assessing the signature to identify risk
in continued operation of the turbine. The evaluation resulted in a realization
that this rotor signature suggested a shutdown and machine inspection. The inspection,
combined with the data analysis and prior analysis history, caught the
condition before significant rotor and other system damage took place.
Detecting this incipient failure quickly and correctly allowed for the
equipment's rapid repair and return to service. The estimated saving to the
customer through generation of revenue exceeded $150 million.
Another example of the demonstrated value of M&D
occurred during the normal data review process at the M&DC when it was
noted the combustion exhaust profile of a gas turbine was beginning to change.
The monitoring frequency of this gas turbine was increased from four hour to
one-hour intervals. The unit was placed on M&D combustion alert and the
customer was notified that a potential combustion issue was developing. Exhaust
combustion profiles continued to indicate that a combustion issue indeed had
developed. Using the M&D GTDM monitoring strategy, the customer w-s able to
operate safely for an additional 13 days to a non-critical production time
before the gas turbine was shut down and a combustion inspection focusing on
specific combustion hardware was performed. This recommendation was preceded by
a technical review with the customer to explain what the data indicated.
Results of an inspection revealed that the specific hardware had experienced
cracking, making continued operation of the unit no longer prudent. The unit
was back in operation two days after the unit was shut down for inspection and
subsequent replacement of hardware.
Conclusion
GE’s RS system is part of GE Power
Systems- Energy Services offerings to increase output, performance and
availability. The system consists of modularized functionality, which can
provide a full scope service that will:
- Improve
overall availability and reliability of plant equipment
- Extend
intervals between maintenance outages
- Reduce
the duration of scheduled and forced outages
- Predict
product life cycles
- Optimize
plant output (thermal performance and heat rate)
RS provides the ability to access, transmit, analyze and
report on the operating conditions of a wide range of customer equipment.
Through learning experiences and key technological developments and
acquisitions, RS gives customer operators, managers and diagnostic experts the
proper tools to make equipment, plant and/or fleet-operating decisions.
References
Makansi, J., “Outage/Maintenance
Management Puts Information Technology to Work,” Power, pp. 41-49, January
1994.
Madej, J. et al., “Monitoring and Diagnostics Service Delivery System,” GER 3956, GE Company, 1996.