The purpose of the following
procedure is to estimate the current measurement uncertainties that exist in
testing. The next step after
analyzing current uncertainties in field measurements would be to reduce these
uncertainties using alternative methods. The problem at hand is not to determine what uncertainties
the method invokes, but merely to understand the uncertainty in the
calculations and measurement devices by following the EPA method, assuming it
has no uncertainty in itself.
Essentially the uncertainty measurement involves no Bias created by a
faulty method.
I.
Uncertainty Analysis Procedure
Uncertainty quantification is
very judgmental and requires experience and understanding of the testing method
The quantity being determined is defined by Y, the parameters (inputs) used to determine Y are X1, X2, X3 … Xi. These quantities are estimated by the terms y, x1, x2, x3 …xi.
The standard uncertainty of an input is u(xi), the combined standard uncertainty is uc(y), and the expanded uncertainty is the value which is reported.
The following procedure is merely a guide in how to obtain these quantities
K – Coverage factor
n – Number of recorded values
r – Coefficient of level of Covariance
s – Sample variance
u(xi) – Standard Uncertainty
uc(y) – Combined Uncertainty
Xi – Input parameter of which the quantity is desired to be known
xi – Input parameter that is actually measured
![]() –
Mean value of measured parameter
–
Mean value of measured parameter
Y – Output result that is desired to calculate
y – Output result that is actually calculated
- Write down equations that are used in calculations
- Determine uncertainty sources
- Variables being measured
- Contributions due to the testing process (some research might be necessary)
i. Spatial variation
Uncertainty that results in too
few measurements
i.e.
Calculations assume uniform flow in stack velocity
ii. Human factors
Uncertainty that arises due to
probe alignment errors
iii. Precision
Uncertainty associated with
reading the measurement
- List all instruments that are used in testing
Systematic uncertainties are
instrument specific so instruments need only be listed once
- Determine systematic uncertainties
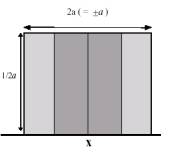
- Provided by manufacturer (x±a) – judgment must be used based on assumed probability distribution
i. For
Rectangular distribution ![]()
Used in situation where any
value within the uncertainty can be assumed to have the same probability of
occurring
i.e.
purity of substance
ii. For
Triangular distribution ![]()
Situation in which it is more
probable that the measurement is closer to the mean
i.e.
Calibration of weighing scale

iii. For Normal distribution
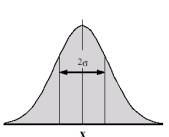
I>
Given as standard deviation (u =s), relative standard
deviation (![]() ), or coefficient of variance CV% (
), or coefficient of variance CV% (![]() )
)
II> Uncertainty is given directly (±c)
I. 95% Confidence Interval (u=c/2)
II. 99.7% Confidence Interval (u=c/3)
- Determined experimentally from repeated observations, u=s (s is sample variance – defined in 8)
If test data is available from
a certain procedure for which n>30 an uncertainty can be associated with
this procedure through the variance (s)
- Determined theoretically
Estimating the uncertainty from well understood physical principles such as thermal expansion
- Listed in EPA methods as minimum accuracy
- Determine
the sensitivity of parameters,

The
sensitivity quantifies the effect the parameter has on the output
- Solve analytically
- Assuming
y is linear in xi or u/x is small — solve numerically by
- Solve experimentally (alter xi while observing the effect to y)
Calculated by ![]()
- Determine level of covariance, qik [u(xi,xk) = u(xi)u(xk)rik][ -1<qik<1]
Correlation between two input
variables effect the combined standard uncertainty (The effect of one parameter
might negate the effect of the other)
- Previous
tests (covik
 )
) - Analytical studies
- Experience
Educated Guess
- Calculate Combined Uncertainty
General calculation: ![]()
- Determine
overall uncertainty,

- sobs is the Random Uncertainty observed and calculated in two ways
i. Normal distribution
I> For instances when n > 30 (many samples)
II>
![]()
ii. Student’s t distribution
I> Most likely case, n<30 (few samples)
II> Approaches the normal distribution as n à 30
III>
![]()
- Expanded Uncertainty = K*u
K = Coverage factor that is a multiplier which is used to convert between uncertainty and reportable Confidence Interval. It is dependent on degrees of freedom (n-1) and desired Confidence Interval
Must find the t-value for a
two tailed Confidence Interval from software or tables. The accompanied spreadsheet solves for this
value
Glossary
Confidence Interval – Defines the amount of probability that the measurement falls between two values
For
Example: A 95% Confidence Interval
categorizes the region of values (shaded) in which it is 95% probable that the
value falls within.
Ref: psych.rice.edu/online_stat/ chapter8/mean.html
Random Uncertainty – Uncertainty that is created during the test by the random dispersion of data
Systematic Uncertainties – Uncertainties that are based on the test setup or procedure and can be determined from previous tests.