METHOD 306 -
DETERMINATION OF CHROMIUM EMISSIONS FROM DECORATIVE AND HARD CHROMIUM
ELECTROPLATING AND CHROMIUM ANODIZING OPERATIONS - ISOKINETIC METHOD
Note: This method does not include all of the
specifications (e.g., equipment
and supplies) and procedures (e.g., sampling and analytical) essential to its performance. Some
material is incorporated by reference from other methods in 40 CFR Part 60,
Appendix A. Therefore, to obtain reliable results, persons using this method
should have a thorough knowledge of at least Method 5.
3.8 Calibration
Reference Standards
3.12 Inter-element
Correction Factors
3.13 Duplicate Sample
Analysis
4.1.1 ICP Spectral
Interferences.
4.1.2 ICP Physical
Interferences.
4.1.3 ICP Chemical
Interferences.
4.2.1 GFAAS Chemical
Interferences.
4.2.2 GFAAS Cyanide
Band Interferences.
4.2.3 GFAAS Spectral
Interferences.
4.2.4 GFAAS Background
Interferences.
4.3.1 IC/PCR Chemical
Interferences.
4.3.2 IC/PCR Background
Interferences.
7.3 Sample Preparation
and Analysis.
7.4 Glassware Cleaning
Reagents.
7.5 Quality Assurance
Audit Samples.
8.0 Sample Collection,
Preservation, Holding Times, Storage, and Transport.
8.3 Sample
Preservation, Storage, and Transport.
9.1.1 ICP Calibration
Reference Standards.
9.1.2 ICP Continuing
Check Standard.
9.1.5 ICP Duplicate
Sample Analysis.
9.1.7 ICP Field Reagent
Blank.
9.2.1 GFAAS Calibration
Reference Standards.
9.2.2 GFAAS Continuing
Check Standard.
9.2.3 GFAAS Calibration
Blank.
9.2.4 GFAAS Duplicate
Sample Analysis.
9.2.6 GFAAS Method of
Standard Additions.
9.2.7 GFAAS Field
Reagent Blank.
9.3.1 IC/PCR
Calibration Reference Standards.
9.3.2 IC/PCR Continuing
Check Standard and Calibration Blank.
9.3.3 IC/PCR Duplicate
Sample Analysis.
9.3.5 IC/PCR Field
Reagent Blank.
10.0 Calibration and
Standardization.
10.1 Sampling Train
Calibration.
11.2.1 The ICP analysis
is applicable for the determination of total chromium only.
11.2.3 ICP Instrument
Adjustment.
11.2.4 ICP Instrument
Calibration.
11.2.5 ICP Operational
Quality Control Procedures.
11.3 GFAAS Sample
Preparation.
11.4.1 The GFAAS
analysis is applicable for the determination of total chromium only.
11.4.3 GFAAS Instrument
Adjustment.
11.4.4 Furnace
Operational Parameters.
11.4.5 GFAAS
Operational Quality Control Procedures.
11.4.7 Reporting
Analytical Results.
11.5 IC/PCR Sample
Preparation.
11.5.3 Sample
Preconcentration (older instruments).
11.6.1 The IC/PCR
analysis is applicable for hexavalent chromium measurements only.
11.6.5 IC/PCR
Instrument Calibration.
11.6.6 IC/PCR
Instrument Operation.
11.6.7 IC/PCR
Operational Quality Control Procedures.
11.6.8 IC/PCR Sample
Dilution.
11.6.9 Reporting
Analytical Results.
12.0 Data Analysis and
Calculations.
12.1.1 Pretest Protocol
(Site Test Plan).
12.1.2 Post Test
Calculations.
17.0 Tables, Diagrams,
Flowcharts, and Validation Data.
1.0 Scope and Application.
1.1 Analytes.
1.2 Applicability.
This method applies to the determination of chromium (Cr) in emissions from
decorative and hard chrome electroplating facilities, chromium anodizing
operations, and continuous chromium plating operations at iron and steel
facilities.
1.3 Data Quality
Objectives. [Reserved]
2.0 Summary of Method.
2.1 Sampling.
An emission sample
is extracted isokinetically from the source using an unheated Method 5 sampling
train (40 CFR Part 60, Appendix A), with a glass nozzle and probe liner, but
with the filter omitted. The sample time shall be at least two hours. The Cr
emissions are collected in an alkaline solution containing 0.1 N sodium
hydroxide (NaOH) or 0.1 N sodium bicarbonate (NaHCO3). The collected samples are recovered using
an alkaline solution and are then transported to the laboratory for analysis.
2.2 Analysis.
2.2.1 Total
chromium samples with high chromium concentrations (>35 µg/L) may be
analyzed using inductively coupled plasma emission spectrometry (ICP) at 267.72
nm.
NOTE: The ICP analysis is applicable for this
method only when the solution analyzed has a Cr concentration greater than or
equal to 35 µg/L or five times the method detection limit as determined
according to Appendix B in 40 CFR Part 136.
2.2.2
Alternatively, when lower total chromium concentrations (<35 µg/L) are
encountered, a portion of the alkaline sample solution may be digested with
nitric acid and analyzed by graphite furnace atomic absorption spectroscopy
(GFAAS) at 357.9 nm.
2.2.3 If it is
desirable to determine hexavalent chromium (Cr+6)
emissions, the samples may be analyzed using an ion chromatograph equipped with
a post-column reactor (IC/PCR) and a visible wavelength detector. To increase
sensitivity for trace levels of Cr+6, a
preconcentration system may be used in conjunction with the IC/PCR.
3.0 Definitions.
3.1 Total Chromium
Measured chromium
content that includes both major chromium oxidation states (Cr+3, Cr+6).
3.2 May
Implies an
optional operation.
3.3 Digestion
The analytical
operation involving the complete (or nearly complete) dissolution of the sample
in order to ensure the complete solubilization of the element (analyte) to be
measured.
3.4 Interferences
Physical,
chemical, or spectral phenomena that may produce a high or low bias in the
analytical result.
3.5 Analytical System
All components of
the analytical process including the sample digestion and measurement
apparatus.
3.6 Sample Recovery
The quantitative
transfer of sample from the collection apparatus to the sample preparation
(digestion, etc.) apparatus. This term should not be confused with analytical
recovery.
3.7 Matrix Modifier
A chemical modification
to the sample during GFAAS determinations to ensure that the analyte is not
lost during the measurement process (prior to the atomization stage)
3.8 Calibration Reference Standards
Quality control
standards used to check the accuracy of the instrument calibration curve prior
to sample analysis.
3.9 Continuing Check Standard
Quality control
standards used to verify that unacceptable drift in the measurement system has
not occurred.
3.10 Calibration Blank
A blank used to
verify that there has been no unacceptable shift in the baseline either
immediately following calibration or during the course of the analytical
measurement.
3.11 Interference Check
An
analytical/measurement operation that ascertains whether a measurable
interference in the sample exists.
3.12 Inter-element Correction Factors
Factors used to
correct for interfering elements that produce a false signal (high bias).
3.13 Duplicate Sample Analysis
Either the repeat
measurement of a single solution or the measurement of duplicate preparations
of the same sample. It is important to be aware of which approach is required
for a particular type of measurement. For example, no digestion is required for
the ICP determination and the duplicate instrument measurement is therefore
adequate whereas duplicate digestion/instrument measurements are required for
GFAAS.
3.14 Matrix Spiking
Analytical spikes
that have been added to the actual sample matrix either before (Section
9.2.5.2) or after (Section 9.1.6). Spikes added to the sample prior to a
preparation technique (e.g., digestion) allow for the assessment of an overall
method accuracy while those added after only provide for the measurement
accuracy determination.
4.0 Interferences.
4.1 ICP Interferences.
4.1.1 ICP Spectral Interferences.
Spectral
interferences are caused by: overlap of a spectral line from another element;
unresolved overlap of molecular band spectra; background contribution from
continuous or recombination phenomena; and, stray light from the line emission
of high-concentrated elements. Spectral overlap may be compensated for by
correcting the raw data with a computer and measuring the interfering element.
At the 267.72 nm Cr analytical wavelength, iron, manganese, and uranium are
potential interfering elements. Background and stray light interferences can
usually be compensated for by a background correction adjacent to the
analytical line. Unresolved overlap requires the selection of an
alternative chromium wavelength.
Consult the instrument manufacturer's
operation manual
for interference correction procedures.
4.1.2 ICP Physical Interferences.
High levels of
dissolved solids in the samples may cause significant inaccuracies due to salt
buildup at the nebulizer and torch tips. This problem can be controlled by
diluting the sample or by extending the rinse times between sample analyses.
Standards shall be prepared in the same solution matrix as the samples (i.e.,
0.1 N NaOH or 0.1 N NaHCO3).
4.1.3 ICP Chemical Interferences.
These include
molecular compound formation, ionization effects and solute vaporization
effects, and are usually not significant in the ICP procedure, especially if
the standards and samples are matrix matched.
4.2 GFAAS Interferences.
4.2.1 GFAAS Chemical Interferences.
Low concentrations
of calcium and/or phosphate may cause interferences; at concentrations above
200 µg/L, calcium's effect is constant and eliminates the effect of phosphate.
Calcium nitrate is therefore added to the concentrated analyte to ensure a
known constant effect. Other matrix modifiers recommended by the instrument
manufacturer may also be considered.
4.2.2 GFAAS Cyanide Band Interferences.
Nitrogen should
not be used as the purge gas due to cyanide band interference.
4.2.3 GFAAS Spectral Interferences.
Background correction
may be required because of possible significant levels of nonspecific
absorption and scattering at the 357.9 nm analytical wavelength.
4.2.4 GFAAS Background Interferences.
Zeeman or
Smith-Hieftje background correction is recommended for interferences resulting
from high levels of dissolved solids in the alkaline impinger solutions.
4.3 IC/PCR Interferences.
4.3.1 IC/PCR Chemical Interferences.
Components in the
sample matrix may cause Cr+6
to convert to trivalent chromium
(Cr+3) or cause Cr+3 to
convert to Cr+6. The chromatographic separation of Cr+6 using ion chromatography reduces the
potential for other metals to interfere with the post column reaction. For the
IC/PCR analysis, only compounds that coelute with Cr+6 and affect the diphenylcarbazide reaction
will cause interference.
4.3.2 IC/PCR Background Interferences.
Periodic analyses
of reagent water blanks are used to demonstrate that the analytical system is
essentially free of contamination. Sample cross-contamination can occur when high-level
and low-level samples or standards are analyzed alternately and can be
eliminated by thorough purging of the sample loop. Purging of the sample can
easily be achieved by increasing the injection volume to ten times the size of
the sample loop.
5.0 Safety.
5.1 Disclaimer.
This method may involve hazardous materials, operations, and equipment. This
test method may not address all of the safety problems associated with its use.
It is the responsibility of the user to establish appropriate safety and health
practices and to determine the applicability of regulatory limitations prior to
performing this test method.
5.2 Hexavalent
chromium compounds have been listed as carcinogens although chromium (III)
compounds show little or no toxicity. Chromium can be a skin and respiratory
irritant.
6.0 Equipment and Supplies.
6.1 Sampling Train.
6.1.1 A schematic
of the sampling train used in this method is shown in Figure 306-1. The train
is the same as shown in Method 5, Section 6.0 (40 CFR Part 60, Appendix A)
except that the probe liner is unheated, the particulate filter is omitted, and
quartz or borosilicate glass must be used for the probe nozzle and liner in
place of stainless steel.
6.1.2 Probe
fittings of plastic such as Teflon, polypropylene, etc. are recommended over
metal fittings to prevent contamination. If desired, a single combined probe
nozzle and liner may be used, but such a single glass assembly is not a
requirement of this methodology.
6.1.3 Use 0.1 N
NaOH or 0.1 N NaHCO3
in the impingers in place of
water.
6.1.4 Operating
and maintenance procedures for the sampling train are described in APTD-0576 of
Method 5. Users should read the APTD-0576 document and adopt the outlined
procedures.
6.1.5 Similar
collection systems which have been approved by the Administrator may be used.
6.2 Sample Recovery.
Same as Method 5,
[40 CFR Part 60, Appendix A], with the following exceptions:
6.2.1 Probe-Liner
and Probe-Nozzle Brushes. Brushes are not necessary for sample recovery. If a
probe brush is used, it must be non-metallic.
6.2.2 Sample
Recovery Solution. Use 0.1 N NaOH or 0.1 N NaHCO3,
whichever is used as the impinger absorbing solution, in place of acetone to
recover the sample.
6.2.3 Sample
Storage Containers. Polyethylene, with leak-free screw cap, 250 mL, 500 mL or
1,000 mL.
6.3 Analysis.
6.3.1 General.
For analysis, the
following equipment is needed.
6.3.1.1 Phillips
Beakers. (Phillips beakers are preferred, but regular beakers may also be
used.)
6.3.1.2 Hot Plate.
6.3.1.3 Volumetric
Flasks. Class A, various sizes as appropriate.
6.3.1.4 Assorted
Pipettes.
6.3.2 Analysis by ICP.
6.3.2.1 ICP
Spectrometer. Computer-controlled emission spectrometer with background
correction and radio frequency generator.
6.3.2.2 Argon Gas
Supply. Welding grade or better.
6.3.3 Analysis by GFAAS.
6.3.3.1 Chromium
Hollow Cathode Lamp or Electrodeless Discharge Lamp.
6.3.3.2 Graphite
Furnace Atomic Absorption Spectrophotometer.
6.3.3.3 Furnace
Autosampler
6.3.4 Analysis by IC/PCR.
6.3.4.1 IC/PCR
System. High performance liquid chromatograph pump, sample injection valve,
post-column reagent delivery and mixing system, and a visible detector, capable
of operating at 520 nm-540 nm, all with a nonmetallic (or inert) flow path. An
electronic peak area mode is recommended, but other recording devices and
integration techniques are acceptable provided the repeatability criteria and
the linearity criteria for the calibration curve described in Section 10.4 can
be satisfied. A sample loading system is required if preconcentration is
employed.
6.3.4.2 Analytical
Column. A high performance ion chromatograph (HPIC) non-metallic column with
anion separation characteristics and a high loading capacity designed for
separation of metal chelating compounds to prevent metal interference.
Resolution described in Section 11.6 must be obtained. A non-metallic guard
column with the same ion-exchange material is recommended.
6.3.4.3
Preconcentration Column (for older instruments). An HPIC non-metallic column
with acceptable anion retention characteristics and sample loading rates must
be used as described in Section 11.6.
6.3.4.4 Filtration
Apparatus for IC/PCR.
6.3.4.4.1 Teflon,
or equivalent, filter holder to accommodate 0.45-µm acetate, or equivalent,
filter, if needed to remove insoluble particulate matter.
6.3.4.4.2 0.45-µm
Filter Cartridge. For the removal of insoluble material. To be used just prior
to sample injection/analysis.
7.0 Reagents and Standards.
NOTE: Unless otherwise indicated, all reagents
should conform to the specifications established by the Committee on Analytical
Reagents of the American Chemical Society (ACS reagent grade). Where such
specifications are not available, use the best available grade. Reagents should
be checked by the appropriate analysis prior to field use to assure that
contamination is below the analytical detection limit for the ICP or GFAAS
total chromium analysis; and that contamination is below the analytical
detection limit for Cr+6
using IC/PCR for direct
injection or, if selected, preconcentration.
7.1 Sampling.
7.1.1 Water.
Reagent water that conforms to ASTM Specification D1193-77 or 91 Type II
(incorporated by reference see §63.14). All references to water in the method
refer to reagent water unless otherwise specified. It is recommended that water
blanks be checked prior to preparing the sampling reagents to ensure that the
Cr content is less than three (3) times the anticipated detection limit of the
analytical method.
7.1.2 Sodium
Hydroxide (NaOH) Absorbing Solution, 0.1 N. Dissolve 4.0 g of sodium hydroxide
in 1 liter of water to obtain a pH of approximately 8.5.
7.1.3 Sodium
Bicarbonate (NaHCO3) Absorbing Solution, 0.1 N. Dissolve
approximately 8.5 g of sodium bicarbonate in 1 liter of water to obtain a pH of
approximately 8.3.
7.1.4 Chromium
Contamination.
7.1.4.1 The
absorbing solution shall not exceed the QC criteria noted in Section 7.1.1 (<
3 times the instrument detection limit).
7.1.4.2 When the
Cr+6 content in the field samples exceeds the
blank concentration by at least a factor of ten (10), Cr+6 blank concentrations < 10 times the
detection limit will be allowed.
NOTE: At sources with high concentrations of acids
and/or SO2, the concentration of NaOH or NaHCO3 should be > 0.5 N to insure that
the pH of the solution remains at or above 8.5 for NaOH and 8.0 for NaHCO3 during and after sampling.
7.1.5 Silica Gel.
Same as in Method 5.
7.2 Sample Recovery.
7.2.1 0.1 N NaOH
or 0.1 N NaHCO3. Use the same solution for the sample
recovery that is used for the impinger absorbing solution.
7.2.2 pH Indicator
Strip, for IC/PCR. pH indicator capable of determining the pH of solutions
between the pH range of 7 and 12, at 0.5 pH increments.
7.3 Sample Preparation and Analysis.
7.3.1 Nitric Acid
(HNO3), Concentrated, for GFAAS. Trace metals
grade or better HNO3
must be used for reagent
preparation. The ACS reagent grade HNO3 is
acceptable for cleaning glassware.
7.3.2 HNO3, 1.0% (v/v), for GFAAS. Prepare, by slowly
stirring, 10 mL of concentrated HNO3 into
800 mL of reagent water. Dilute to 1,000 mL with reagent water. The solution
shall contain less than 0.001 mg Cr/L.
7.3.3 Calcium
Nitrate Ca(NO3)2 Solution
(10 µg Ca/mL) for GFAAS analysis. Prepare the solution by weighing 40.9 mg of
Ca(NO3)2 into
a 1 liter volumetric flask. Dilute with reagent water to 1 liter.
7.3.4 Matrix
Modifier, for GFAAS. See instrument manufacturer's manual for suggested matrix
modifier.
7.3.5
Chromatographic Eluent, for IC/PCR. The eluent used in the analytical system is
ammonium sulfate based.
7.3.5.1 Prepare by
adding 6.5 mL of 29 percent ammonium hydroxide (NH4OH) and 33 g of ammonium sulfate ((NH4)2SO4) to 500 mL of reagent water. Dilute to 1
liter with reagent water and mix well.
7.3.5.2 Other
combinations of eluents and/or columns may be employed provided peak
resolution, repeatability,
linearity, and analytical sensitivity as described in Sections 9.3 and
11.6 are acceptable.
7.3.6 Post-Column
Reagent, for IC/PCR. An effective post-column reagent for use with the
chromatographic eluent described in Section 7.3.5 is a diphenylcarbazide
(DPC)-based system. Dissolve 0.5 g of 1,5-diphenylcarbazide in 100 mL of ACS
grade methanol. Add 500 mL of reagent water containing 50 mL of 96 percent
spectrophotometric grade sulfuric acid. Dilute to 1 liter with reagent water.
7.3.7 Chromium
Standard Stock Solution (1000 mg/L). Procure a certified aqueous standard or
dissolve 2.829 g of potassium dichromate (K2Cr2O7),
in reagent water and dilute to 1 liter.
7.3.8 Calibration
Standards for ICP or IC/PCR. Prepare calibration standards for ICP or IC/PCR by
diluting the Cr standard stock solution (Section 7.3.7) with 0.1 N NaOH or 0.1
N NaHCO3, whichever is used as the impinger absorbing
solution, to achieve a matrix similar to the actual field samples. Suggested
levels are 0, 50, 100, and 200 µg Cr/L for ICP, and 0, 1, 5, and 10 µg Cr+6/L for IC/PCR.
7.3.9 Calibration
Standards for GFAAS. Chromium solutions for GFAAS calibration shall contain 1.0
percent (v/v) HNO3. The zero standard shall be 1.0 percent
(v/v) HNO3. Calibration standards should be prepared
daily by diluting the Cr standard stock solution (Section 7.3.7) with 1.0
percent HNO3. Use at least four standards to make the
calibration curve. Suggested levels are 0, 10, 50, and 100 µg Cr/L.
7.4 Glassware Cleaning Reagents.
7.4.1 HNO3, Concentrated. ACS reagent grade or
equivalent.
7.4.2 Water.
Reagent water that conforms to ASTM Specification D1193-77 or 91 Type II.
7.4.3 HNO3, 10 percent (v/v). Add by stirring 500 mL of
concentrated HNO3
into a flask containing
approximately 4,000 mL of reagent water. Dilute to 5,000 mL with reagent water.
Mix well. The reagent shall contain less than 2 µg Cr/L.
7.5 Quality Assurance Audit Samples.
7.5.1 When making
compliance determinations, and upon availability, audit samples shall be
obtained from the appropriate EPA regional Office or from the responsible
enforcement authority and analyzed in conjunction with the field samples.
7.5.2 If EPA or
National Institute of Standards and Technology (NIST) reference audit sample
are not available, a mid-range standard, prepared from an independent
commercial source, may be used.
NOTE: To order audit samples, contact the
responsible enforcement authority at least 30 days prior to the test date to
allow sufficient time for the audit sample to be delivered.
8.0 Sample Collection, Preservation, Holding Times, Storage, and Transport.
NOTE: Prior to sample collection, consideration
should be given to the type of analysis (Cr+6 or
total Cr) that will be performed. Which analysis option(s) will be performed
will determine which sample recovery and storage procedures will be required to
process the sample (See Figures 306-3 and 306-4).
8.1 Sample Collection.
Same as Method 5
(40 CFR Part 60, Appendix A), with the following exceptions.
8.1.1 Omit the
particulate filter and filter holder from the sampling train. Use a glass
nozzle and probe liner instead of stainless steel. Do not heat the probe. Place
100 mL of 0.1 N NaOH or 0.1 N NaHCO3 in
each of the first two impingers, and record the data for each run on a data
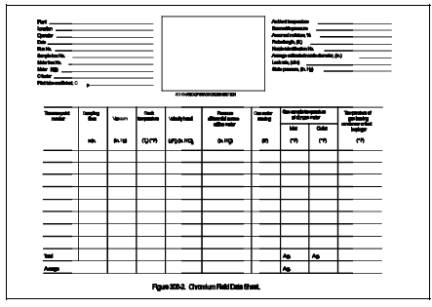
sheet such as shown in Figure 306-2.
8.1.2 Clean all
glassware prior to sampling in hot soapy water designed for laboratory cleaning
of glassware. Next, rinse the glassware three times with tap water, followed by
three additional rinses with reagent water. Then soak the glassware in 10%
(v/v) HNO3 solution for a minimum of 4 hours, rinse
three times with reagent water, and allow to air dry. Cover all glassware
openings where contamination can occur with Parafilm, or equivalent, until the
sampling train is assembled for sampling.
8.1.3 Train
Operation. Follow the basic procedures outlined in Method 5 in conjunction with
the following instructions. Train sampling rate shall not exceed 0.030 m3/min (1.0 cfm) during a run.
8.2 Sample Recovery.
Follow the basic
procedures of Method 5, with the exceptions noted.
8.2.1 A
particulate filter is not recovered from this train.
8.2.2 Tester shall
select either the total Cr or Cr+6 sample
recovery option.
8.2.3 Samples to
be analyzed for both total Cr and Cr+6,
shall be recovered using the Cr+6 sample option
(Section 8.2.6).
8.2.4 A field
reagent blank shall be collected for either of the Cr or the Cr+6 analysis. If both analyses (Cr and Cr+6) are to be conducted on the samples, collect
separate reagent blanks for each analysis.
NOTE: Since particulate matter is not usually
present at chromium electroplating and/or chromium anodizing operations, it is
not necessary to filter the Cr+6 samples unless
there is observed sediment in the collected solutions. If it is necessary to
filter the Cr+6 solutions, please refer to Method 0061,
Determination of Hexavalent Chromium Emissions From Stationary Sources, Section
7.4, Sample Preparation in SW-846 (see Reference 1).
8.2.5 Total Cr
Sample Option.
8.2.5.1 Container
No. 1. Measure the volume of the liquid in the first, second, and third
impingers and quantitatively transfer into a labeled sample container.
8.2.5.2 Use
approximately 200 to 300 mL of the 0.1 N NaOH or 0.1 N NaHCO3 absorbing solution to rinse the probe nozzle,
probe liner, three impingers, and connecting glassware; add this rinse to
Container No. 1.
8.2.6 Cr+6 Sample Option.
8.2.6.1 Container
No. 1. Measure and record the pH of the absorbing solution contained in the
first impinger at the end of the sampling run using a pH indicator strip. The
pH of the solution must be >8.5 for NaOH and >8.0 for NaHCO3. If it is not, discard the collected sample,
increase the normality of the NaOH or NaHCO3 impinger
absorbing solution to 0.5 N or to a solution normality approved by the
Administrator and collect another air emission sample.
8.2.6.2 After
determining the pH of the first impinger solution, combine and measure the
volume of the liquid in the first, second, and third impingers and
quantitatively transfer into the labeled sample container. Use approximately
200 to 300 mL of the 0.1 N NaOH or 0.1 N NaHCO3 absorbing
solution to rinse the probe nozzle, probe liner, three impingers, and
connecting glassware; add this rinse to Container No. 1.
8.2.7 Field
Reagent Blank.
8.2.7.1 Container
No. 2.
8.2.7.2 Place
approximately 500 mL of the 0.1 N NaOH or 0.1 N NaHCO3 absorbing solution into a labeled sample
container.
8.3 Sample Preservation, Storage, and Transport.
8.3.1 Total Cr
Sample Option. Samples to be
analyzed for total Cr need not be refrigerated.
8.3.2 Cr+6 Sample Option. Samples to be analyzed for Cr+6 must be shipped and stored at 4NC. Allow Cr+6 samples to return to ambient temperature
prior to analysis.
8.4 Sample Holding Times.
8.4.1 Total Cr
Sample Option. Samples to be
analyzed for total Cr shall be analyzed within 60 days of collection.
8.4.2 Cr+6 Sample Option. Samples to be analyzed for Cr+6 shall be analyzed within 14 days of
collection.
9.0 Quality Control.
9.1 ICP Quality Control.
9.1.1 ICP Calibration Reference Standards.
Prepare a
calibration reference standard using the same alkaline matrix as the
calibration standards; it should be at least 10 times the instrumental
detection limit.
9.1.1.1 This
reference standard must be prepared from a different Cr stock solution source
than that used for preparation of the calibration curve standards.
9.1.1.2 Prior to
sample analysis, analyze at least one reference standard.
9.1.1.3 The
calibration reference standard must be measured within 10 percent of it's true
value for the curve to be considered valid.
9.1.1.4 The curve
must be validated before sample analyses are performed.
9.1.2 ICP Continuing Check Standard.
9.1.2.1 Perform
analysis of the check standard with the field samples as described in Section
11.2 (at least after every 10 samples, and at the end of the analytical run).
9.1.2.2 The check
standard can either be the mid-range calibration standard or the reference
standard. The results of the check standard shall agree within 10 percent of
the expected value; if not, terminate the analyses, correct the problem,
recalibrate the instrument, and rerun all samples analyzed subsequent to the
last acceptable check standard analysis.
9.1.3 ICP Calibration Blank.
9.1.3.1 Perform
analysis of the calibration blank with the field samples as described in
Section 11.2 (at least after every 10 samples, and at the end of the analytical
run).
9.1.3.2 The
results of the calibration blank shall agree within three standard deviations
of the mean blank value. If not, analyze the calibration blank two more times
and average the results. If the average is not within three standard deviations
of the background mean, terminate the analyses, correct the problem,
recalibrate, and reanalyze all samples analyzed subsequent to the last
acceptable calibration blank analysis.
9.1.4 ICP Interference Check.
Prepare an
interference check solution that contains known concentrations of interfering
elements that will provide an adequate test of the correction factors in the
event of potential spectral interferences.
9.1.4.1 Two
potential interferences, iron and manganese, may be prepared as 1000 µg/mL and
200 µg/mL solutions, respectively. The solutions should be prepared in dilute
HNO3 (1-5 percent). Particular care must be used
to ensure that the solutions and/or salts used to prepare the solutions are of
ICP grade purity (i.e., that no measurable Cr contamination exists in the
salts/solutions). Commercially prepared interfering element check standards are
available.
9.1.4.2 Verify the
interelement correction factors every three months by analyzing the
interference check solution. The correction factors are calculated according to
the instrument manufacturer's directions. If the interelement correction
factors are used properly, no false Cr should be detected.
9.1.4.3 Negative
results with an absolute value greater than three (3) times the detection limit
are usually the results of the background correction position being set
incorrectly. Scan the spectral region to ensure that the correction position
has not been placed on an interfering peak.
9.1.5 ICP Duplicate Sample Analysis.
Perform one
duplicate sample analysis for each compliance sample batch (3 runs).
9.1.5.1 As there
is no sample preparation required for the ICP analysis, a duplicate analysis is
defined as a repeat analysis of one of the field samples. The selected sample
shall be analyzed using the same procedures that were used to analyze the
original sample.
9.1.5.2 Duplicate
sample analyses shall agree within 10 percent of the original measurement
value.
9.1.5.3 Report the
original analysis value for the sample and report the duplicate analysis value
as the QC check value. If agreement is not achieved, perform the duplicate
analysis again. If agreement is not achieved the second time, perform
corrective action to identify and correct the problem before analyzing the
sample for a third time.
9.1.6 ICP Matrix Spiking.
Spiked samples
shall be prepared and analyzed daily to ensure that there are no matrix
effects, that samples and standards have been matrix-matched, and that the
laboratory equipment is operating properly.
9.1.6.1 Spiked
sample recovery analyses should indicate a recovery for the Cr spike of between
75 and 125 percent.
9.1.6.2 Cr levels
in the spiked sample should provide final solution concentrations that are
within the linear portion of the calibration curve, as well as, at a
concentration level at least: equal to that of the original sample; and, ten
(10) times the detection limit.
9.1.6.3 If the
spiked sample concentration meets the stated criteria but exceeds the linear
calibration range, the spiked sample must be diluted with the field absorbing
solution.
9.1.6.4 If the
recoveries for the Cr spiked samples do not meet the specified criteria,
perform corrective action to identify and correct the problem prior to
reanalyzing the samples.
9.1.7 ICP Field Reagent Blank.
9.1.7.1 Analyze a
minimum of one matrix-matched field reagent blank (Section 8.2.4) per sample
batch to determine if contamination or memory effects are occurring.
9.1.7.2 If
contamination or memory effects are observed, perform corrective action to
identify and correct the problem before reanalyzing the samples.
9.1.8 Audit Sample Analysis.
9.1.8.1 When the
method is used to analyze samples to demonstrate compliance with a source
emission regulation, an audit sample must be analyzed, subject to availability.
9.1.8.2
Concurrently analyze the audit sample and the compliance samples in the same
manner to evaluate the technique of the analyst and the standards preparation.
9.1.8.3 The same
analyst, analytical reagents, and analytical system shall be used for the
compliance samples and the audit sample. If this condition is met, duplicate
auditing of subsequent compliance analyses for the same enforcement agency
within a 30-day period is waived. An audit sample set may not be used to
validate different sets of compliance samples under the jurisdiction of
separate enforcement agencies, unless prior arrangements have been made with
both enforcement agencies.
9.1.9 Audit Sample Results.
9.1.9.1 Calculate
the audit sample concentrations and submit results using the instructions
provided with the audit samples.
9.1.9.2 Report the
results of the audit samples and the compliance determination samples along
with their identification numbers, and the analyst's name to the responsible
enforcement authority. Include this information with reports of any subsequent
compliance analyses for the same enforcement authority during the 30-day
period.
9.1.9.3 The
concentrations of the audit samples obtained by the analyst shall agree within
the values specified by the compliance auditor. If the specified range is not
met, reanalyze the compliance and audit samples, and include initial and
reanalysis values in the test report.
9.1.9.4 Failure to
meet the specified range may require retests unless the audit problems are
resolved. However, if the audit results do not affect the compliance or noncompliance
status of the affected facility, the Administrator may waive the reanalysis
requirement, further audits, or retests and accept the results of the
compliance test. While steps are being taken to resolve audit analysis
problems, the Administrator may also choose to use the data to determine the
compliance or noncompliance status of the affected facility.
9.2 GFAAS Quality Control.
9.2.1 GFAAS Calibration Reference Standards.
The calibration
curve must be verified by using at least one calibration reference standard
(made from a reference material or other independent standard material) at or
near the mid-range of the calibration curve.
9.2.1.1 The
calibration curve must be validated before sample analyses are performed.
9.2.1.2 The
calibration reference standard must be measured within 10 percent of its true
value for the curve to be considered valid.
9.2.2 GFAAS Continuing Check Standard.
9.2.2.1 Perform
analysis of the check standard with the field samples as described in Section
11.4 (at least after every 10 samples, and at the end of the analytical run).
9.2.2.2 These
standards are analyzed, in part, to monitor the life and performance of the
graphite tube. Lack of reproducibility or a significant change in the signal
for the check standard may indicate that the graphite tube should be replaced.
9.2.2.3 The check
standard may be either the mid-range calibration standard or the reference
standard.
9.2.2.4 The
results of the check standard shall agree within 10 percent of the expected
value.
9.2.2.5 If not,
terminate the analyses, correct the problem, recalibrate the instrument, and
reanalyze all samples analyzed subsequent to the last acceptable check standard
analysis.
9.2.3 GFAAS Calibration Blank.
9.2.3.1 Perform
analysis of the calibration blank with the field samples as described in
Section 11.4 (at least after every 10 samples, and at the end of the analytical
run).
9.2.3.2 The
calibration blank is analyzed to monitor the life and performance of the
graphite tube as well as the existence of any memory effects. Lack of
reproducibility or a significant change in the signal, may indicate that the
graphite tube should be replaced.
9.2.3.3 The
results of the calibration blank shall agree within three standard deviations
of the mean blank value.
9.2.3.4 If not,
analyze the calibration blank two more times and average the results. If the
average is not within three standard deviations of the background mean,
terminate the analyses, correct the problem, recalibrate, and reanalyze all
samples analyzed subsequent to the last acceptable calibration blank analysis.
9.2.4 GFAAS Duplicate Sample Analysis.
Perform one
duplicate sample analysis for each compliance sample batch (3 runs).
9.2.4.1 A digested
aliquot of the selected sample is processed and analyzed using the identical
procedures that were used for the whole sample preparation and analytical
efforts.
9.2.4.2 Duplicate
sample analyses results incorporating duplicate digestions shall agree within
20 percent for sample results exceeding ten (10) times the detection limit.
9.2.4.3 Report the
original analysis value for the sample and report the duplicate analysis value
as the QC check value.
9.2.4.4 If
agreement is not achieved, perform the duplicate analysis again. If agreement
is not achieved the second time, perform corrective action to identify and
correct the problem before analyzing the sample for a third time.
9.2.5 GFAAS Matrix Spiking.
9.2.5.1 Spiked
samples shall be prepared and analyzed daily to ensure that (1) correct procedures
are being followed, (2) there are no matrix effects and (3) all equipment is
operating properly.
9.2.5.2 Cr spikes
are added prior to any sample preparation.
9.2.5.3 Cr levels
in the spiked sample should provide final solution concentrations that are
within the linear portion of the calibration curve, as well as, at a
concentration level at least: equal to that of the original sample; and, ten
(10) times the detection limit.
9.2.5.4 Spiked
sample recovery analyses should indicate a recovery for the Cr spike of between
75 and 125 percent.
9.2.5.5 If the
recoveries for the Cr spiked samples do not meet the specified criteria,
perform corrective action to identify and correct the problem prior to
reanalyzing the samples.
9.2.6 GFAAS Method of Standard Additions.
9.2.6.1 Method of
Standard Additions. Perform procedures in Section 5.4 of Method 12 (40 CFR Part
60, Appendix A)
9.2.6.2 Whenever
sample matrix problems are suspected and standard/sample matrix matching is not
possible or whenever a new sample matrix is being analyzed, perform referenced
procedures to determine if the method of standard additions is necessary.
9.2.7 GFAAS Field Reagent Blank.
9.2.7.1 Analyze a
minimum of one matrix-matched field reagent blank (Section 8.2.4) per sample batch
to determine if contamination or memory effects are occurring. 9.2.7.2 If
contamination or memory effects are observed, perform corrective action to
identify and correct the problem before reanalyzing the samples.
9.2.8 Audit Sample Analysis.
9.2.8.1 When the
method is used to analyze samples to demonstrate compliance with a source
emission regulation, an audit sample must be analyzed, subject to availability.
9.2.8.2
Concurrently analyze the audit sample and the compliance samples in the same
manner to evaluate the technique of the analyst and the standards preparation.
9.2.8.3 The same
analyst, analytical reagents, and analytical system shall be used for the
compliance samples and the audit sample. If this condition is met, duplicate
auditing of subsequent compliance analyses for the same enforcement agency
within a 30-day period is waived. An audit sample set may not be used to
validate different sets of compliance samples under the jurisdiction of
separate enforcement agencies, unless prior arrangements have been made with
both enforcement agencies.
9.2.9 Audit Sample Results.
9.2.9.1 Calculate
the audit sample concentrations and submit results using the instructions
provided with the audit samples.
9.2.9.2 Report the
results of the audit samples and the compliance determination samples along
with their identification numbers, and the analyst's name to the responsible
enforcement authority. Include this information with reports of any subsequent
compliance analyses for the same enforcement authority during the 30-day
period.
9.2.9.3 The
concentrations of the audit samples obtained by the analyst shall agree within
the values specified by the compliance auditor. If the specified range is not
met, reanalyze the compliance and audit samples, and include initial and
reanalysis values in the test report.
9.2.9.4 Failure to
meet the specified range may require retests unless the audit problems are
resolved. However, if the audit results do not affect the compliance or
noncompliance status of the affected facility, the Administrator may waive the
reanalysis requirement, further audits, or retests and accept the results of
the compliance test. While steps are being taken to resolve audit analysis
problems, the Administrator may also choose to use the data to determine the
compliance or noncompliance status of the affected facility.
9.3 IC/PCR Quality Control.
9.3.1 IC/PCR Calibration Reference Standards.
9.3.1.1 Prepare a
calibration reference standard at a concentration that is at or near the
mid-point of the calibration curve using the same alkaline matrix as the
calibration standards. This reference standard should be prepared from a
different Cr stock solution than that used to prepare the calibration curve
standards. The reference standard is used to verify the accuracy of the
calibration curve.
9.3.1.2 The curve
must be validated before sample analyses are performed. Prior to sample
analysis, analyze at least one reference standard with an expected value within
the calibration range.
9.3.1.3 The
results of this reference standard analysis must be within 10 percent of the
true value of the reference standard for the calibration curve to be considered
valid.
9.3.2 IC/PCR Continuing Check Standard and Calibration Blank.
9.3.2.1 Perform
analysis of the check standard and the calibration blank with the field samples
as described in Section 11.6 (at least after every 10 samples, and at the end
of the analytical run).
9.3.2.2 The result
from the check standard must be within 10 percent of the expected value.
9.3.2.3 If the 10
percent criteria is exceeded, excessive drift and/or instrument degradation may
have occurred, and must be corrected before further analyses can be performed.
9.3.2.4 The
results of the calibration blank analyses must agree within three standard
deviations of the mean blank value.
9.3.2.5 If not,
analyze the calibration blank two more times and average the results.
9.3.2.6 If the
average is not within three standard deviations of the background mean,
terminate the analyses, correct the problem, recalibrate, and reanalyze all
samples analyzed subsequent to the last acceptable calibration blank analysis.
9.3.3 IC/PCR Duplicate Sample Analysis.
9.3.3.1 Perform
one duplicate sample analysis for each compliance sample batch (3 runs).
9.3.3.2 An aliquot
of the selected sample is prepared and analyzed using procedures identical to
those used for the emission samples (for example, filtration and/or, if
necessary, preconcentration).
9.3.3.3 Duplicate
sample injection results shall agree within 10 percent for sample results
exceeding ten (10) times the detection limit.
9.3.3.4 Report the
original analysis value for the sample and report the duplicate analysis value
as the QC check value.
9.3.3.5 If
agreement is not achieved, perform the duplicate analysis again.
9.3.3.6 If
agreement is not achieved the second time, perform corrective action to
identify and correct the problem prior to analyzing the sample for a third
time.
9.3.4 ICP/PCR Matrix Spiking.
Spiked samples
shall be prepared and analyzed with each sample set to ensure that there are no
matrix effects, that samples and standards have been matrix-matched, and that
the equipment is operating properly.
9.3.4.1 Spiked
sample recovery analysis should indicate a recovery of the Cr+6 spike between 75 and 125 percent.
9.3.4.2 The spiked
sample concentration should be within the linear portion of the calibration
curve and should be equal to or greater than the concentration of the original
sample. In addition, the spiked sample concentration should be at least ten
(10) times the detection limit.
9.3.4.3 If the
recoveries for the Cr+6
spiked samples do not meet the
specified criteria, perform corrective action to identify and correct the
problem prior to reanalyzing the samples.
9.3.5 IC/PCR Field Reagent Blank.
9.3.5.1 Analyze a
minimum of one matrix-matched field reagent blank (Section 8.2.4) per sample
batch to determine if contamination or memory effects are occurring.
9.3.5.2 If
contamination or memory effects are observed, perform corrective action to
identify and correct the problem before reanalyzing the samples.
9.3.6 Audit Sample Analysis.
9.3.6.1 When the
method is used to analyze samples to demonstrate compliance with source
emission regulation, an audit sample must be analyzed, subject to availability.
9.3.6.2
Concurrently analyze the audit sample and the compliance samples in the same
manner to evaluate the technique of the analyst and the standards preparation.
9.3.6.3 The same
analyst, analytical reagents, and analytical system shall be used for the
compliance samples and the audit sample. If this condition is met, duplicate
auditing of subsequent compliance analyses for the same enforcement agency
within a 30-day period is waived. An audit sample set may not be used to
validate different sets of compliance samples under the jurisdiction of
separate enforcement agencies, unless prior arrangements have been made with
both enforcement agencies.
9.3.7 Audit Sample Results.
9.3.7.1 Calculate
the audit sample concentrations and submit results using the instructions
provided with the audit samples.
9.3.7.2 Report the
results of the audit samples and the compliance determination samples along
with their identification numbers, and the analyst's name to the responsible enforcement
authority. Include this information with reports of any subsequent compliance
analyses for the same enforcement authority during the 30-day period.
9.3.7.3 The
concentrations of the audit samples obtained by the analyst shall agree within
the values specified by the compliance auditor. If the specified range is not
met, reanalyze the compliance and audit samples, and include initial and
reanalysis values in the test report.
9.3.7.4 Failure to
meet the specified range may require retests unless the audit problems are
resolved. However, if the audit results do not affect the compliance or
noncompliance status of the affected facility, the Administrator may waive the
reanalysis requirement, further audits, or retests and accept the results of
the compliance test. While steps are being taken to resolve audit analysis
problems, the Administrator may also choose to use the data to determine the
compliance or noncompliance status of the affected facility.
10.0 Calibration and Standardization.
10.1 Sampling Train Calibration.
Perform
calibrations described in Method 5, (40 CFR Part 60, Appendix A). The alternate
calibration procedures described in Method 5, may also be used.
10.2 ICP Calibration.
10.2.1 Calibrate
the instrument according to the instrument manufacturer's recommended
procedures, using a calibration blank and three standards for the initial
calibration.
10.2.2 Calibration
standards should be prepared fresh daily, as described in Section 7.3.8. Be
sure that samples and calibration standards are matrix matched. Flush the
system with the calibration blank between each standard.
10.2.3 Use the
average intensity of multiple exposures (3 or more) for both standardization
and sample analysis to reduce random error.
10.2.4 Employing
linear regression, calculate the correlation coefficient .
10.2.5 The
correlation coefficient must equal or exceed 0.995.
10.2.6 If
linearity is not acceptable, prepare and rerun another set of calibration
standards or reduce the range of the calibration standards, as necessary.
10.3 GFAAS Calibration.
10.3.1 For
instruments that measure directly in concentration, set the instrument software
to display the correct concentration, if applicable.
10.3.2 Curve must
be linear in order to correctly perform the method of standard additions which
is customarily performed automatically with most instrument computer-based data
systems.
10.3.3 The
calibration curve (direct calibration or standard additions) must be prepared
daily with a minimum of a calibration blank and three standards that are
prepared fresh daily.
10.3.4 The
calibration curve acceptance criteria must equal or exceed 0.995.
10.3.5 If
linearity is not acceptable, prepare and rerun another set of calibration
standards or reduce the range of calibration standards, as necessary.
10.4 IC/PCR Calibration.
10.4.1 Prepare a
calibration curve using the calibration blank and three calibration standards
prepared fresh daily as described in Section 7.3.8.
10.4.2 The
calibration curve acceptance criteria must equal or exceed 0.995.
10.4.3 If
linearity is not acceptable, remake and/or rerun the calibration standards. If
the calibration curve is still unacceptable, reduce the range of the curve.
10.4.4 Analyze the
standards with the field samples as described in Section 11.6.
11.0 Analytical Procedures.
NOTE: The method determines the chromium
concentration in µg Cr/mL. It is important that the analyst measure the field
sample volume prior to analyzing the sample. This will allow for conversion of
µg Cr/mL to µg Cr/sample.
11.1 ICP Sample Preparation.
11.1.1 The ICP
analysis is performed directly on the alkaline impinger solution; acid
digestion is not necessary, provided the samples and standards are matrix
matched.
11.1.2 The ICP
analysis should only be employed when the solution analyzed has a Cr
concentration greater than 35 µg/L or five times the method detection limit as
determined according to Appendix B in 40 CFR Part 136 or by other commonly
accepted analytical procedures.
11.2 ICP Sample Analysis.
11.2.1 The ICP analysis is applicable for the determination of total chromium only.
11.2.2 ICP Blanks.
Two types of
blanks are required for the ICP analysis.
11.2.2.1
Calibration Blank. The calibration blank is used in establishing the
calibration curve. For the calibration blank, use either 0.1 N NaOH or 0.1 N
NaHCO3, whichever is used for the impinger
absorbing solution. The calibration blank can be prepared fresh in the
laboratory; it does not have to be prepared from the same batch of solution
that was used in the field. A sufficient quantity should be prepared to flush
the system between standards and samples.
11.2.2.2 Field
Reagent Blank. The field reagent blank is collected in the field during the
testing program. The field reagent blank (Section 8.2.4) is an aliquot of the
absorbing solution prepared in Section 7.1.2. The reagent blank is used to
assess possible contamination resulting from sample processing.
11.2.3 ICP Instrument Adjustment.
11.2.3.1 Adjust
the ICP instrument for proper operating parameters including wavelength,
background correction settings (if necessary), and interfering element
correction settings (if necessary).
11.2.3.2 The
instrument must be allowed to become thermally stable before beginning
measurements (usually requiring at least 30 min of operation prior to
calibration). During this warmup period, the optical calibration and torch
position optimization may be performed (consult the operator's manual).
11.2.4 ICP Instrument Calibration.
11.2.4.1 Calibrate
the instrument according to the instrument manufacturer's recommended
procedures, and the procedures specified in Section 10.2.
11.2.4.2 Prior to
analyzing the field samples, reanalyze the highest calibration standard as if
it were a sample.
11.2.4.3
Concentration values obtained should not deviate from the actual values or from
the established control limits by more than 5 percent, whichever is lower (see
Sections 9.1 and 10.2).
11.2.4.4 If they
do, follow the recommendations of the instrument manufacturer to correct the
problem.
11.2.5 ICP Operational Quality Control Procedures.
11.2.5.1 Flush the
system with the calibration blank solution for at least 1 min before the
analysis of each sample or standard.
11.2.5.2 Analyze
the continuing check standard and the calibration blank after each batch of 10
samples.
11.2.5.3 Use the
average intensity of multiple exposures for both standardization and sample
analysis to reduce random error.
11.2.6 ICP Sample Dilution.
11.2.6.1 Dilute
and reanalyze samples that are more concentrated than the linear calibration
limit or use an alternate, less sensitive Cr wavelength for which quality
control data have already been established.
11.2.6.2 When
dilutions are performed, the appropriate factors must be applied to sample
measurement results.
11.2.7 Reporting
Analytical Results. All analytical results should be reported in µg Cr/mL using
three significant figures. Field sample volumes (mL) must be reported also.
11.3 GFAAS Sample Preparation.
11.3.1 GFAAS Acid
Digestion. An acid digestion of the alkaline impinger solution is required for
the GFAAS analysis.
11.3.1.1 In a
beaker, add 10 mL of concentrated HNO3 to
a 100 mL sample aliquot that has been well mixed. Cover the beaker with a watch
glass. Place the beaker on a hot plate and reflux the sample to near dryness.
Add another 5 mL of concentrated HNO3 to
complete the digestion. Again, carefully reflux the sample volume to near
dryness. Rinse the beaker walls and watch glass with reagent water.
11.3.1.2 The final
concentration of HNO3
in the solution should be 1
percent (v/v).
11.3.1.3 Transfer
the digested sample to a 50-mL volumetric flask. Add 0.5 mL of concentrated HNO3 and 1 mL of the 10 µg/mL of Ca(NO3)2.
Dilute to 50 mL with reagent water.
11.3.2 HNO3 Concentration. A different final volume may
be used based on the expected Cr concentration, but the HNO3 concentration must be maintained at 1 percent
(v/v).
11.4 GFAAS Sample Analysis.
11.4.1 The GFAAS analysis is applicable for the determination of total chromium only.
11.4.2 GFAAS Blanks.
Two types of
blanks are required for the GFAAS analysis.
11.4.2.1
Calibration Blank. The 1.0 percent HNO3 is
the calibration blank which is used in establishing the calibration curve.
11.4.2.2 Field
Reagent Blank. An aliquot of the 0.1 N NaOH solution or the 0.1 N NaHCO3 prepared in Section 7.1.2 is collected for
the field reagent blank. The field reagent blank is used to assess possible
contamination resulting from processing the sample.
11.4.2.2.1 The
reagent blank must be subjected to the entire series of sample preparation and
analytical procedures, including the acid digestion.
11.4.2.2.2 The
reagent blank's final solution must contain the same acid concentration as the
sample solutions.
11.4.3 GFAAS Instrument Adjustment.
11.4.3.1 The 357.9
nm wavelength line shall be used.
11.4.3.2 Follow
the manufacturer's instructions for all other spectrophotometer operating
parameters.
11.4.4 Furnace Operational Parameters.
Parameters
suggested by the manufacturer should be employed as guidelines.
11.4.4.1
Temperature-sensing mechanisms and temperature controllers can vary between
instruments and/or with time; the validity of the furnace operating parameters
must be periodically confirmed by systematically altering the furnace parameters
while analyzing a standard. In this manner, losses of analyte due to
higher-than-necessary temperature settings or losses in sensitivity due to less
than optimum settings can be minimized.
11.4.4.2 Similar
verification of furnace operating parameters may be required for complex sample
matrices (consult instrument manual for additional information). Calibrate the
GFAAS system following the procedures specified in Section 10.3.
11.4.5 GFAAS Operational Quality Control Procedures.
11.4.5.1 Introduce
a measured aliquot of digested sample into the furnace and atomize.
11.4.5.2 If the
measured concentration exceeds the calibration range, the sample should be
diluted with the calibration blank solution (1.0 percent HNO3) and reanalyzed.
11.4.5.3 Consult the
operator's manual for suggested injection volumes. The use of multiple
injections can improve accuracy and assist in detecting furnace pipetting
errors.
11.4.5.4 Analyze a
minimum of one matrix-matched reagent blank per sample batch to determine if
contamination or any memory effects are occurring.
11.4.5.5 Analyze a
calibration blank and a continuing check standard after approximately every
batch of 10 sample injections.
11.4.6 GFAAS Sample Dilution.
11.4.6.1 Dilute
and reanalyze samples that are more concentrated than the instrument
calibration range.
11.4.6.2 If
dilutions are performed, the appropriate factors must be applied to sample
measurement results.
11.4.7 Reporting Analytical Results.
11.4.7.1 Calculate
the Cr concentrations by the method of standard additions (see operator's
manual) or, from direct calibration. All dilution and/or concentration factors
must be used when calculating the results.
11.4.7.2
Analytical results should be reported in µg Cr/mL using three significant
figures. Field sample volumes (mL) must be reported also.
11.5 IC/PCR Sample Preparation.
11.5.1 Sample pH.
Measure and record
the sample pH prior to analysis.
11.5.2 Sample Filtration.
Prior to
preconcentration and/or analysis, filter all field samples through a 0.45-µm
filter. The filtration step should be conducted just prior to sample
injection/analysis.
11.5.2.1 Use a
portion of the sample to rinse the syringe filtration unit and acetate filter
and then collect the required volume of filtrate.
11.5.2.2 Retain
the filter if total Cr is to be determined also.
11.5.3 Sample Preconcentration (older instruments).
11.5.3.1 For older
instruments, a preconcentration system may be used in conjunction with the
IC/PCR to increase sensitivity for trace levels of Cr+6.
11.5.3.2 The
preconcentration is accomplished by selectively retaining the analyte on a
solid absorbent, followed by removal of the analyte from the absorbent (consult
instrument manual).
11.5.3.3 For a
manual system, position the injection valve so that the eluent displaces the
concentrated Cr+6
sample, transferring it from the
preconcentration column and onto the IC anion separation column.
11.6 IC/PCR Sample Analyses.
11.6.1 The IC/PCR analysis is applicable for hexavalent chromium measurements only.
11.6.2 IC/PCR Blanks.
Two types of
blanks are required for the IC/PCR analysis.
11.6.2.1
Calibration Blank. The calibration blank is used in establishing the analytical
curve. For the calibration blank, use either 0.1 N NaOH or 0.1 N NaHCO3, whichever is used for the impinger
solution. The calibration blank can be prepared fresh in the laboratory; it
does not have to be prepared from the same batch of absorbing solution that is
used in the field.
11.6.2.2 Field
Reagent Blank. An aliquot of the 0.1 N NaOH solution or the 0.1 N NaHCO3 solution prepared in Section 7.1.2 is
collected for the field reagent blank. The field reagent blank is used to
assess possible contamination resulting from processing the sample.
11.6.3 Stabilized Baseline.
Prior to sample
analysis, establish a stable baseline with the detector set at the required
attenuation by setting the eluent and post-column reagent flow rates according
to the manufacturers recommendations.
NOTE: As long as the ratio of eluent flow rate to
PCR flow rate remains constant, the standard curve should remain linear. Inject
a sample of reagent water to ensure that no Cr+6 appears
in the water blank.
11.6.4 Sample Injection Loop.
Size of injection
loop is based on standard/sample concentrations and the selected attenuator
setting.
11.6.4.1 A 50-µL
loop is normally sufficient for most higher concentrations.
11.6.4.2 The
sample volume used to load the injection loop should be at least 10 times the
loop size so that all tubing in contact with the sample is thoroughly flushed
with the new sample to prevent cross contamination.
11.6.5 IC/PCR Instrument Calibration.
11.6.5.1 First,
inject the calibration standards prepared, as described in Section 7.3.8 to
correspond to the appropriate concentration range, starting with the lowest
standard first.
11.6.5.2 Check the
performance of the instrument and verify the calibration using data gathered
from analyses of laboratory blanks, calibration standards, and a quality
control sample.
11.6.5.3 Verify
the calibration by analyzing a calibration reference standard. If the measured
concentration exceeds the established value by more than 10 percent, perform a
second analysis. If the measured concentration still exceeds the established
value by more than 10 percent, terminate the analysis until the problem can be
identified and corrected.
11.6.6 IC/PCR Instrument Operation.
11.6.6.1 Inject
the calibration reference standard (as described in Section 9.3.1), followed by
the field reagent blank (Section 8.2.4), and the field samples.
11.6.6.1.1
Standards (and QC standards) and samples are injected into the sample loop of
the desired size (use a larger size loop for greater sensitivity). The Cr+6 is collected on the resin bed of the column.
11.6.6.1.2 After
separation from other sample components, the Cr+6 forms
a specific complex in the post-column reactor with the DPC reaction solution,
and the complex is detected by visible absorbance at a maximum wavelength of
540 nm.
11.6.6.1.3 The
amount of absorbance measured is proportional to the concentration of the Cr+6 complex formed.
11.6.6.1.4 The IC
retention time and the absorbance of the Cr+6 complex
with known Cr+6 standards analyzed under identical conditions
must be compared to provide both qualitative and quantitative analyses.
11.6.6.1.5 If a
sample peak appears near the expected retention time of the Cr+6 ion, spike the sample according to Section
9.3.4 to verify peak identity.
11.6.7 IC/PCR Operational Quality Control Procedures.
11.6.7.1 Samples
should be at a pH >8.5 for NaOH and >8.0 if using NaHCO3; document any discrepancies.
11.6.7.2
Refrigerated samples should be allowed to equilibrate to ambient temperature
prior to preparation and analysis.
11.6.7.3 Repeat
the injection of the calibration standards at the end of the analytical run to
assess instrument drift. Measure areas or heights of the Cr+6/DPC complex chromatogram peaks.
11.6.7.4 To ensure
the precision of the sample injection (manual or autosampler), the response for
the second set of injected standards must be within 10 percent of the average
response.
11.6.7.5 If the 10
percent criteria duplicate injection cannot be achieved, identify the source of
the problem and rerun the calibration standards.
11.6.7.6 Use peak
areas or peak heights from the injections of calibration standards to generate
a linear calibration curve. From the calibration curve, determine the
concentrations of the field samples.
11.6.8 IC/PCR Sample Dilution.
11.6.8.1 Samples
having concentrations higher than the established calibration range must be
diluted into the calibration range and re-analyzed.
11.6.8.2 If
dilutions are performed, the appropriate factors must be applied to sample
measurement results.
11.6.9 Reporting Analytical Results.
Results should be
reported in µg Cr+6/mL using three significant figures. Field
sample volumes (mL) must be reported also.
12.0 Data Analysis and Calculations.
12.1 Pretest Calculations.
12.1.1 Pretest Protocol (Site Test Plan).
12.1.1.1 The
pretest protocol should define and address the test data quality objectives
(DQOs), with all assumptions, that will be required by the end user
(enforcement authority); what data are needed? why are the data needed? how
will the data be used? what are method
detection limits?
and what are estimated target analyte levels for the following test parameters.
12.1.1.1.1
Estimated source concentration for total chromium and/or Cr+6.
12.1.1.1.2
Estimated minimum sampling time and/or volume required to meet method detection
limit requirements (Appendix B 40 CFR Part 136) for measurement of total
chromium and/or Cr+6.
12.1.1.1.3
Demonstrate that planned sampling parameters will meet DQOs. The protocol must
demonstrate that the planned sampling parameters calculated by the tester will
meet the needs of the source and the enforcement authority.
12.1.1.2 The
pre-test protocol should include information on equipment, logistics,
personnel, process operation, and other resources necessary for an efficient
and coordinated test.
12.1.1.3 At a
minimum, the pre-test protocol should identify and be approved by the source,
the tester, the analytical laboratory, and the regulatory enforcement
authority. The tester should not proceed with the compliance testing before
obtaining approval from the enforcement authority.
12.1.2 Post Test Calculations.
12.1.2.1 Perform
the calculations, retaining one extra decimal figure beyond that of the
acquired data. Round off figures after final calculations.
12.1.2.2
Nomenclature.
CS = Concentration of Cr in sample solution, µg
Cr/mL.
Ccr = Concentration of Cr in stack gas, dry
basis, corrected to standard conditions, mg/dscm.
D = Digestion
factor, dimension less.
F = Dilution
factor, dimension less.
MCr = Total Cr in each sample, µg.
Vad = Volume of sample aliquot after digestion,
mL.
Vaf = Volume of sample aliquot after dilution,
mL.
Vbd = Volume of sample aliquot submitted to
digestion, mL.
Vbf = Volume of sample aliquot before dilution,
mL.
VmL = Volume of impinger contents plus rinses,
mL.
Vm(std) = Volume of gas sample measured by the dry
gas meter, corrected to standard conditions, dscm.
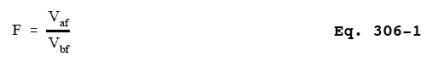
12.1.2.3 Dilution
Factor. The dilution factor is the ratio of the volume of sample aliquot after
dilution to the volume before dilution. This ratio is given by the following
equation:
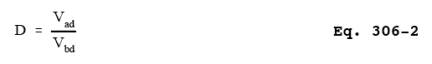
12.1.2.4 Digestion
Factor. The digestion factor is the ratio of the volume of sample aliquot after
digestion to the volume before digestion. This ratio is given by Equation
306-2.
12.1.2.5 Total Cr
in Sample. Calculate MCr, the total µg Cr in each sample, using the
following equation:
![]()
12.1.2.6 Average
Dry Gas Meter Temperature and Average Orifice Pressure Drop. Same as Method 5.
12.1.2.7 Dry Gas
Volume, Volume of Water Vapor, Moisture Content. Same as Method 5.
12.1.2.8 Cr
Emission Concentration (CCr). Calculate CCr,
the Cr concentration in the stack gas, in mg/dscm on a dry basis, corrected to
standard conditions using the following equation:
12.1.2.9
Isokinetic Variation, Acceptable Results. Same as Method 5.
13.0 Method Performance.
13.1 Range.
The recommended
working range for all of the three analytical techniques starts at five times
the analytical detection limit (see also Section 13.2.2). The upper limit of
all three techniques can be extended indefinitely by appropriate dilution.
13.2 Sensitivity.
13.2.1 Analytical
Sensitivity. The estimated instrumental detection limits listed are provided as
a guide for an instrumental limit. The actual method detection limits are
sample and instrument dependent and may vary as the sample matrix varies.
13.2.1.2 ICP
Analytical Sensitivity. The minimum estimated detection limits for ICP, as
reported in Method 6010A and the recently revised Method 6010B of SW-846
(Reference 1), are 7.0 µg Cr/L and 4.7 µg Cr/L, respectively.
13.2.1.3 GFAAS
Analytical Sensitivity. The minimum estimated detection limit for GFAAS, as
reported in Methods 7000A and 7191 of SW-846 (Reference 1), is 1 µg Cr/L.
13.2.1.4 IC/PCR
Analytical Sensitivity. The minimum detection limit for IC/PCR with a
preconcentrator, as reported in Methods 0061 and 7199 of SW-846 (Reference 1),
is 0.05 µg Cr+6/L.
1.3.2.1.5
Determination of Detection Limits. The laboratory performing the Cr+6 measurements must determine the method
detection limit on a quarterly basis using a suitable procedure such as that
found in 40 CFR, Part 136, Appendix B. The determination should be made on
samples in the appropriate alkaline matrix. Normally this involves the
preparation (if applicable) and consecutive measurement of seven (7) separate
aliquots of a sample with a concentration <5 times the expected detection
limit. The detection limit is 3.14 times the standard deviation of these
results.
13.2.2 In-stack
Sensitivity. The in-stack sensitivity depends upon the analytical detection
limit, the volume of stack gas sampled, the total volume of the impinger
absorbing solution plus the rinses, and, in some cases, dilution or
concentration factors from sample preparation. Using the analytical detection
limits given in Sections 13.2.1.1, 13.2.1.2, and 13.2.1.3; a stack gas sample
volume of 1.7 dscm; a total liquid sample volume of 500 mL; and the digestion
concentration factor of 1/2 for the GFAAS analysis; the corresponding in-stack
detection limits are 0.0014 mg Cr/dscm to 0.0021 mg Cr/dscm for ICP, 0.00015 mg Cr/dscm for GFAAS, and 0.000015 mg Cr+6/dscm for IC/PCR with preconcentration.
NOTE: It is recommended that the concentration of
Cr in the analytical solutions be at least five times the analytical detection
limit to optimize sensitivity in the analyses. Using this guideline and the
same assumptions for impinger sample volume, stack gas sample volume, and the
digestion concentration factor for the GFAAS analysis (500 mL,1.7 dscm, and
1/2, respectively), the recommended minimum stack concentrations for optimum sensitivity
are 0.0068 mg Cr/dscm to 0.0103 mg Cr/dscm for ICP, 0.00074 mg Cr/dscm for
GFAAS, and 0.000074 mg Cr+6/dscm
for IC/PCR with preconcentration.
If required, the in-stack detection limits can be improved by either increasing
the stack gas sample volume, further reducing the volume of the digested sample
for GFAAS, improving the analytical detection limits, or any combination of the
three.
13.3 Precision.
13.3.1 The
following precision data have been reported for the three analytical methods.
In each case, when the sampling precision is combined with the reported
analytical precision, the resulting overall precision may decrease.
13.3.2 Bias data
is also reported for GFAAS.
13.4 ICP Precision.
13.4.1 As reported
in Method 6010B of SW-846 (Reference 1), in an EPA round-robin Phase 1 study,
seven laboratories applied the ICP technique to acid/distilled water matrices
that had been spiked with various metal concentrates. For true values of 10,
50, and 150 µg Cr/L; the mean reported values were 10, 50, and 149 µg Cr/L; and
the mean percent relative standard deviations were 18, 3.3, and 3.8 percent,
respectively.
13.4.2 In another
multi laboratory study cited in Method 6010B, a mean relative standard of 8.2
percent was reported for an aqueous sample concentration of approximately 3750
µg Cr/L.
13.5 GFAAS Precision.
As reported in
Method 7191 of SW-846 (Reference 1), in a single laboratory (EMSL), using
Cincinnati, Ohio tap water spiked at concentrations of 19, 48, and 77 µg Cr/L,
the standard deviations were ±0.1, ±0.2, and ±0.8, respectively. Recoveries at
these levels were 97 percent, 101 percent, and 102 percent, respectively.
13.6 IC/PCR Precision.
As reported in
Methods 0061 and 7199 of SW-846 (Reference 1), the precision of IC/PCR with
sample preconcentration is 5 to 10 percent. The overall precision for sewage
sludge incinerators emitting 120 ng/dscm of Cr+6 and
3.5 µg/dscm of total Cr was 25 percent and 9 percent, respectively; and for
hazardous waste incinerators emitting 300 ng/dscm of Cr+6 the precision was 20 percent.
14.0 Pollution Prevention.
14.1 The only
materials used in this method that could be considered pollutants are the
chromium standards used for instrument calibration and acids used in the
cleaning of the collection and measurement containers/labware, in the
preparation of standards, and in the acid digestion of samples. Both reagents
can be stored in the same waste container.
14.2 Cleaning
solutions containing acids should be prepared in volumes consistent with use to
minimize the disposal of excessive volumes of acid.
14.3 To the extent
possible, the containers/vessels used to collect and prepare samples should be
cleaned and reused to minimize the generation of solid waste.
15.0 Waste Management.
15.1 It is the
responsibility of the laboratory and the sampling team to comply with all
federal, state, and local regulations governing waste management, particularly
the discharge regulations, hazardous waste identification rules, and land
disposal restrictions; and to protect the air, water, and land by minimizing
and controlling all releases from field operations.
15.2 For further
information on waste management, consult The Waste Management Manual for
Laboratory Personnel and Less
is Better—Laboratory Chemical Management for Waste Reduction, available from the American Chemical
Society's Department of Government Relations and Science Policy, 16th Street
NW, Washington, DC 20036.
16.0 References.
1. “Test Methods
for Evaluating Solid Waste, Physical/Chemical Methods, SW-846, Third Edition,”
as amended by Updates I, II, IIA, IIB, and III. Document No. 955-001-000001.
Available from Superintendent of Documents, U.S. Government Printing Office,
Washington, DC, November 1986.
2. Cox, X.B., R.W.
Linton, and F.E. Butler. Determination of Chromium Speciation in Environmental
Particles - A Multi-technique Study of Ferrochrome Smelter Dust. Accepted for
publication in Environmental Science and Technology.
3. Same as Section
17.0 of Method 5, References 2, 3, 4, 5, and 7.
4. California Air
Resources Board, "Determination of Total Chromium and Hexavalent Chromium
Emissions from Stationary Sources." Method 425, September 12, 1990.
5. The Merck
Index. Eleventh Edition. Merck & Co., Inc., 1989.
6. Walpole, R.E.,
and R.H. Myers. “Probability and Statistics for Scientists and Engineering.”
3rd Edition. MacMillan Publishing Co., NewYork, N.Y., 1985.
17.0 Tables, Diagrams, Flowcharts, and Validation Data.
Figure 306-1
Figure 306-2